Download
1 / 22
220 likes | 307 Views
ESEA Flexibility: Student Growth. Maryland Accountability Program Presentation 6 of 8. Lillian M. Lowery, Ed.D . State Superintendent of Schools Dr. Charlene M. Dukes President, Maryland State Board of Education Martin O'Malley Governor Carolyn M. Wood, Ph.D. Assistant Superintendent

E N D
ESEA Flexibility: Student Growth Maryland Accountability Program Presentation 6 of 8
Lillian M. Lowery, Ed.D.State Superintendent of SchoolsDr. Charlene M. DukesPresident, Maryland State Board of Education Martin O'Malley Governor Carolyn M. Wood, Ph.D. Assistant Superintendent Division of Accountability, Assessment, and Data Systems Maryland State Department of EducationDivision of Accountability, Assessment, and Data Systems 200 West Baltimore StreetBaltimore, Maryland 21201410.767.0073MarylandPublicSchools.org
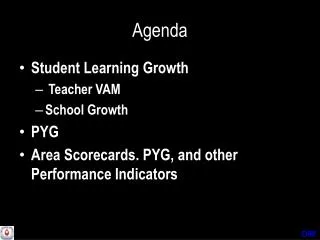
Maryland Accountability Program • School Progress • Reduce by half the percentage of students in the “all students” group and in each subgroup who are not proficient within six years • School Progress Index • Achievement • Gap Reduction • Growth • College & Career Readiness • Differentiated Recognition • Reward • Priority • Focus
Maryland School Progress Index** Grades PreK-8 Grades 9-12 Meeting Performance Targets (AMO) Meeting Performance Targets (AMO) Achievement* Achievement* 30% 40% • 33.3%-Mathematics Proficiency (Algebra/ • Data Analysis HSA) • 33.3%- English Proficiency (English HSA) • 33.3%- Science Proficiency (Biology HSA) • 33.3%- Mathematics Proficiency (MSA) • 33.3%- Reading Proficiency (MSA) • 33.3%- Science Proficiency (MSA) DRAFT Gap* Gap* 40% 40% Gap between lowest subgroup and highest subgroup within a school: Gap between lowest subgroup and highest subgroup within a school: • 33.3%- Mathematics Proficiency (MSA) • 33.3%- Reading Proficiency (MSA) • 33.3%- Science Proficiency (MSA) • 20%- Mathematics Proficiency (Algebra/ • Data Analysis HSA) • 20%- English Proficiency (English HSA) • 20%- Science Proficiency (Biology HSA) • 20%- Cohort Graduation Rate • 20%- Cohort Dropout Rate Growth* College-and Career-Readiness** 30% 20% Percent of students making one year’s growth: • 60%- Cohort Graduation Rate • 40%- College and Career Preparation (CCP) • Advanced Placement • Career and Technology Education (CTE) Concentrators • College Enrollment • 50%- Mathematics Proficiency (MSA) • 50%- Reading Proficiency (MSA) 4 *ALT-MSA is included in the index component **Revised 9/17/2012: To be submitted to USDE for Approval
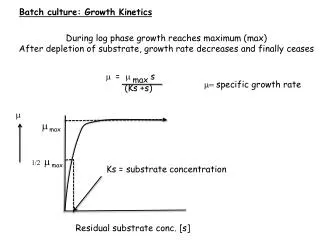
What is Student Growth? • The change in student performance for an individual student between two or more points in time • Three types of change over time: • No Change • Student maintained expected growth from year to year • Student performed at the same level as the prior year • Improvement • Student exceeded expected growth from year to year • Student’s performance increased from prior year • Decline • Student fell short of expected growth from year to year • Student’s performance declined from prior year • Measure: • Compare student performance over two years using MSA performance levels
Requirements to determine a student’s growth • Individual student • Promoted from prior year • Took the corresponding assessment in both years • Performance Data • Reading Scale Score • Mathematics Scale Score • For MSA, MOD, and AltMSA • For two consecutive years • Current year • Prior year • Full Academic Year applies • 1% and 2% rules does NOT apply • Nonparticipants are NOT included within aggregations
MSA Performance Levels • Use MSA Performance Levels to create a standardized score for each year the student tested • Advanced – highly challenging and exemplary level of achievement indicating outstanding accomplishment • Proficient – realistic and rigorous level of achievement indicating proficiency • Basic – Is a level of achievement indicating that more work is needed to attain proficiency
Growth Scores • Each MSA Performance Level is divided into three Performance Scores • Each Performance Scores corresponds to a range of MSA Scale Scores • Use the MSA Score Matrix to determine the Performance Score
Matrix Development • Identify the Highest (HOSS) and Lowest Obtainable Scale Score (LOSS) • Identify the Proficient and Advanced cut scores • Determine upper levels of Basic and Proficient by subtracting 1 from the Cut Score from the adjacent Performance Level • Remaining Scale Scores divided into 3 intervals for each Performance Level Cut Scores HOSS LOSS
MSA Math Score Matrix MSA Performance Level Performance Scores MSA Scale Scores
Calculating Growth for Individual Students • Example 1 – MSA Math • MSA Math Score Matrix • Growth Score Calculation: • Student maintained expected growth from year to year • Student performed at the same level as the prior year
Growth Score Continuum Decline Improvement -8-7-6-5-4-3-2-1012345678 Example 1
Calculating Growth for Individual Students • Example 2 – MSA Math • MSA Math Score Matrix • Growth Score Calculation: • Student exceeded expected growth from year to year • Student’s performance increased from prior year
Growth Score Continuum Decline Improvement -8-7-6-5-4-3-2-1012345678 Example 1 Example 2
Calculating Growth for Individual Students • Example 3 – MSA Math • MSA Math Score Matrix • Growth Score Calculation: • Student fell short of expected growth from year to year • Student’s performance declined from prior year
Growth Score Continuum Decline Improvement -8-7-6-5-4-3-2-1012345678 Example 1 Winnie Example 3 Eeyore Example 2 Robin
Growth Percentage • Counts of students for each growth category • Aggregated at school and LEA levels
Establishing Targets for Growth • 50% reduction in the percentage of students by 2017 demonstrating less than one year’s growth from the prior year for the “all students” group • Baseline year growth percent is determined by the change from SY2009-10 to SY2010-11
Proficiency Progress – Reading and Mathematics AMO Target Calculations
SPI Calculation Example: Elementary School % Prof of Target = % Proficient CY ÷ Target Weighted % Prof of Target = % Prof of Target x Content Weight Indicator Contribution = (Math + Read + Sci) x Indicator Weight School Index = (Achievement + Growth + Gap)
Maryland Accountability Program • School Progress • Reduce by half the percentage of students in the “all students” group and in each subgroup who are not proficient within six years • School Progress Index • Achievement • Gap Reduction • Growth • College & Career Readiness • Differentiated Recognition • Reward • Priority • Focus
Questions? • Please forward questions and comments to: Doug Strader, Ed.D. dstrader@msde.state.md.us 410-767-2055