Download
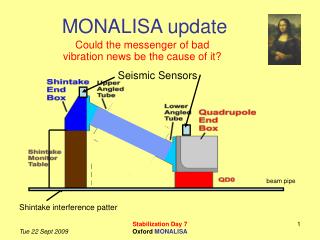
1 / 37
370 likes | 522 Views
MonALISA for Cluster Monitoring. Costin Grigoras <costin.grigoras@cern.ch>. What is MonALISA ?. Caltech project started in 2002 http://monalisa.caltech.edu/ Java-based set of distributed, self-describing services Offers the infrastructure to collect any type of information

E N D
MonALISA for Cluster Monitoring CostinGrigoras <costin.grigoras@cern.ch>
What is MonALISA ? • Caltech project started in 2002http://monalisa.caltech.edu/ • Java-based set of distributed, self-describing services • Offers the infrastructure to collect any type of information • All data can process in near real time • The services can cooperate in performing the monitoring tasks • Can act as a platform for running distributed user agents MonALISA for Cluster Monitoring
MonALISA software components and the connections between them Clients HL services Data consumers Multiplexing layer Helps firewalled endpoints connect Proxies Agents MonALISA services Data gathering services Network of JINI-Lookup Services Secure & Public Registration and discovery Fully Distributed System with no Single Point of Failure MonALISA for Cluster Monitoring
Subscriber/notification paradigm Lookup Service ML Service Registration Discovery AGENTS Predicates & Agents Data Store Data (via ML Proxy) ML Client Configuration Control (SSL) Applications FILTERS / TRIGGERS Dynamic Loading Monitoring Modules Push or Pull, depending on device MonALISA for Cluster Monitoring
Data storage model • MonALISA keeps a memory buffer for a minimal monitoring history • Parallel database backends can be used to increase performance and reliability • In addition, data can be kept in configurable database structures • Default configuration is adapted to the different use cases • the service keeps one week of raw data and one month of averaged values • the repository creates three averaged structures (2mo @ 2m, 1y @ 30m, 10y @ 2.5h) Volatile storage Memory buffer Short term, highresolution Medium term, lowerresolution Persistent storage (DB) Long term, lowresolution time Request at highest resolution Response MonALISA for Cluster Monitoring
Clients • GUI client • Interactive exploring of all the parameters • Can plot history or real-time values • Customizable history query interval • Subscribes to those particular series and updates the plots in real time • Storage client (aka Repository) • Subscribes to a set of parameters and stores them in database structures suitable for long-term archival • Is usually complemented by a web interface presenting these values • Can also be embedded in another controlling application • WebServices clients • Limited functionality: they lack the subscription mechanism MonALISA for Cluster Monitoring
MonALISA service includes many modules; easily extendable • The service package includes: • Local host monitoring (CPU, memory, network traffic , processes and sockets in each state, LM sensors, APC UPSs), log files tailing • SNMP generic & specific modules; • Condor, PBS, LSF and SGE (accounting & host monitoring), Ganglia • Ping, tracepath, traceroute, pathload, xrootd • Ciena, Optical switches (TL1); Netflow/Sflow (Force10) • Calling external applications/scripts that output the values as text • XDR-formatted UDP messages (ApMon) • New modules can be added by implementing a simple Java interface. • Filters can also be defined to aggregate data in new ways • The Service can also react to the monitoring data it receives, more about the actions it can take later MonALISA for Cluster Monitoring
Embeddable APlicationMONitoring library (ApMon) • Lightweight library of APIs (C, C++, Java, Perl, Python) that can be used to send any information to MonALISA Service(s) over UDP • Flexible configuration (hardcoded / configuration file / URL) • Background system monitoring (optional) • Load, CPU, memory & swap usage • Network interfaces (in/out/ip/errs) • Sockets in each state, processes in each state • Disk IO, swap IO • Background application monitoring (optional) • Used CPU & wall time, % of the machine CPU • Partition stats, size of workdir, open files • Memory usage (rss, virtual and %), page faults • Very high throughput (O(10K msg/s) on a regular machine) MonALISA for Cluster Monitoring
AliEn monitoring architecture AliEn IS AliEn Optimizers AliEn CE Cluster Monitor AliEn Job Agent AliEn Brokers AliEn TQ ApMon ApMon ApMon ApMon AliEn SE ApMon ApMon ApMon job slots net In/out run time AliEn Job Agent ApMon cpu time processes free space load jobs status MySQL Servers vsz ApMon sockets MonALISA AliEn Site MonALISA @CERN ApMon rss AliEn Job Agent migrated mbytes ApMon CastorGrid Scripts active sessions Aggregated Data ApMon API Services AliEn SE Cluster Monitor AliEn CE ApMon ApMon ApMon ApMon AliEn Job Agent nr. of files open files Queued JobAgents ApMon MonALISA Repository job status Alerts MonALISA LCG Site cpu ksi2k AliEn Job Agent Actions Long History DB ApMon disk used MyProxy status AliEn Job Agent ApMon http://alimonitor.cern.ch/ LCG Tools 9 MonALISA for Cluster Monitoring
MonALISA @ GSI • Python ApMon-based daemon running on each node, sending host monitoring + custom values to the ALICE VoBox • http://lxgrid2.gsi.de:8080 – The repository that collects, stores and displays the values • Also runs a filter that produces the overall status values GridCluster PROOFCluster StorageCluster ApMon ApMon ApMon LustreCluster Mount status CPU usage Disk IO ApMon MonALISA Repository load Alerts GSI VoBox status memory ServiceCluster Actions jobs users Long History DB ApMon network IO PoD Cluster disk used TransferCluster ApMon SE Frontend Cluster ApMon ApMon http://lxgrid2.gsi.de:8080/ MonALISA for Cluster Monitoring
Some statistics • GSI Repository stores almost as much as ALICE does • But ALICE mostly stores aggregated values, /site or /user MonALISA for Cluster Monitoring
Standard views History charts with annotations Any past time interval can be selected MonALISA for Cluster Monitoring
Standard views MonALISA for Cluster Monitoring
Standard views History chartsin area mode Statistics per host below the charts MonALISA for Cluster Monitoring
Standard views Bar chart with optional second axis for cumulative values MonALISA for Cluster Monitoring
Standard views Pie with several data selection options (last / integral / min / max / avg) Bar charts, same options MonALISA for Cluster Monitoring
Standard views Radar / spider web MonALISA for Cluster Monitoring
Standard views Table view - mostly used to display current status, but aggregation functions are also available MonALISA for Cluster Monitoring
Custom views • Dynamic JSP pages can be added to the web interface • Easy to create new plots based on JFreeChart and the ML data API MonALISA for Cluster Monitoring
Custom views – Links status in USLHCNet MonALISA for Cluster Monitoring
Redundant monitoring • In the case of USLHCNET the monitoring is fully redundant • Each component is monitored by at least two services • Each link is monitored from both ends • The redundant information is filtered at the Repository level • Two independent Repository instances, with the same configuration • 100% monitoring availability Rep 1 Service 1 DNS Rep 2 Service 2 MonALISA for Cluster Monitoring
Network “weather map” http://repository.uslhcnet.org/ MonALISA for Cluster Monitoring
Network “weather map” Real-time traffic information for each link MonALISA for Cluster Monitoring
Automatic actions • Decisions taken upon: • Absence/presence of some parameter(s) • Values above/below predefined thresholds • Arbitrary correlations between values • User-defined code • Action types: • Notifications • RSS/Atom feeds • Annotation of charts with the events • Calling external programs • Logging • Running custom code • Traffic • Jobs • Hosts • Apps ML Service SSL Global ML Services Actions SSL • Temperature • Humidity • A/C Power • … ML Service Sensors Localdecisions Global decisions Actions MonALISA for Cluster Monitoring
Automatic actions in ALICE • Restart of services if the VoBox functional tests fail • Only if central services are ok • Send mail if the restart doesn’t solve the problem • Try again every 12 hours • Storage elements testing from the central point • Notifications if tests fail • Maintaining the DNS aliases of central services • Remove offline or overloaded services • Automatically adding new service instances • Run the entire job workflow for data production (reconstruction, simulation, analysis trains etc) • Other notifications (proxies, SAM tests, central services, temperature in the server room) MonALISA for Cluster Monitoring
Notifications MonALISA for Cluster Monitoring
Firefox toolbar MonALISA for Cluster Monitoring
Configuring triggers series.count=1 series.0=PROD period=60 threshold.success=1 threshold.error=5 threshold.flip_flop=0 rule=$Ezero_if_null($Ctpcalishuttle01/ROOT_SHUTTLE_PROD/__PROCESSINGINFO__/SHUTTLE_status;)>now()-900000; ignore_missing_data=false actions.count=3 action.0.report_err=down action.0.type=email action.0.from=ml_notification_service@pcalimonitor.cern.ch action.0.to=Jan.Fiete.Grosse-Oetringhaus@cern.ch,Raffaele.Grosso@cern.ch,Chiara.Zampolli@cern.ch,agrigora@cern.ch action.0.subject=Shuttle: #0 instance is DOWN action.0.body=Service is down for 20 minutes (last status report at timestamp: $Ctpcalishuttle01/ROOT_SHUTTLE_PROD/__PROCESSINGINFO__/SHUTTLE_status;) … action.2.type=log action.2.file=/home/monalisa/MLrepository/logs/shuttle.log action.2.message=$Edatetime("yyyy-MM-ddHH:mm:ss", now());: #0 Shuttle instance is #MSG MonALISA for Cluster Monitoring
Configuring triggers series.count=1 series.0=aliendb1.cern.ch,\ aliendb2.cern.ch,\ aliendb3.cern.ch,\ CERN,\ … period=60 value=$Cv#0/Machine/memory/swap_used; rule=$E#VALUE<2147483648 && #VALUE/$Cv#0/Machine/memory/swap_total;<0.7; threshold.success=5 threshold.error=5 … actions.count=3 action.0.report_err=down action.0.type=email action.0.from=ml_notification_service@pcalimonitor.cern.ch action.0.to=Costin.Grigoras@cern.ch,latchezar.betev@cern.ch,pablo.saiz@cern.ch action.0.subject=#0 is swapping a lot action.0.body=Swap usage is $Eround((#VALUE/1073741824)*100)/100;GB ($Eround(($Cv#0/Machine/memory/swap_used;/$Cv#0/Machine/memory/swap_total;)*100);%) on #0 … MonALISA for Cluster Monitoring
Configuring triggers series.count=1 series.0=ups_ITEMP period=60 value=$Eavg($Cv*/UPS/localhost/#0;); rule=$E#VALUE<33 threshold.success=15 threshold.error=15 threshold.flip_flop=0 ignore_missing_data=true actions.count=1 action.0.report_err=high action.0.report_ok=normal action.0.type=email action.0.from=ml_notification_service@pcalimonitor.cern.ch action.0.to=Costin.Grigoras@cern.ch,latchezar.betev@cern.ch action.0.subject=Temperature in server room is #MSG action.0.body=Average temperature is : $Eavg($Cv*/UPS/localhost/#0;); MonALISA for Cluster Monitoring
Configuring triggers series.count=1 series.0=aliprod,alidaq,alitrain period=300 threshold.success=1 threshold.error=1 ignore_missing_data=true reload_series=0 rule=$Eif(zero_if_null($CvCERN/ALICE_Users_Jobs_Summary/#0/WAITING_jobs;)>$QSELECT s_value FROM lpm_settings WHERE s_key='submit_trigger';,1,0); # once per hour, try again if the queue is still low rearm.iterations=12 actions.count=2 action.0.report_err=low action.0.report_ok=ok action.0.type=log action.0.file=/home/monalisa/MLrepository/logs/queue_size.log action.0.message=$Edatetime("yyyy-MM-ddHH:mm:ss", now());: Waiting jobs for #0 : $CvCERN/ALICE_Users_Jobs_Summary/#0/WAITING_jobs; (#MSG) action.1.report_err=low action.1.class=alien.repository.QueueLowAction MonALISA for Cluster Monitoring
Configuring triggers series.count=2 series.0=$Qselect name from alien_sites; series.1=CE,PackMan,Monitor,httpd period=60 rule.class=actions.SiteServicesRestartDecision threshold.success=1 threshold.error=5 threshold.flip_flop=0 ignore_missing_data=true rearm.iterations=120 actions.count=2 action.0.class=actions.SiteServicesRestartAction action.0.from=ml_notification_service@pcalimonitor.cern.ch action.0.to=latchezar.betev@cern.ch action.0.subject=Restart #1 at #0 action.0.body=Service test message:\n#VALUE\n\n#MSG … MonALISA for Cluster Monitoring
Filters • The filters see all the data that passes through the component • They can inject new values in the data stream, for example when producing aggregated values • Like the GSI filter that counts the number of nodes in each state, the errors and so on • Or they can act on particular conditions • For example the ALICE memory watchdog (looks at the memory usage of every job in the Grid, sends mail to the users when a threshold is reached, but without flooding) • Making use of the memory data buffer to produce the history chart; we don’t persistently store the data for individual jobs MonALISA for Cluster Monitoring
Memory watchdog MonALISA for Cluster Monitoring
Code sharing within ML • Most of the code is shared between the components • Filters can aggregate data at Service or Repository level • Data storage engine is the same, just with different default configurations • Particular storage needs can be accomplished by new implementations • The actions framework is also fully shared • WebServices interface is available at both levels • Data-producing modules can be inserted in both, though not exactly the same code MonALISA for Cluster Monitoring
MonALISA for GSI • ApMon for host monitoring • Service instance • Repository : http://lxgrid2.gsi.de:8080/ • Actions – none yet, but how about: • Notification in case of • Host not reporting • Problems on the node (mount points / services / load etc) • Automatic procedures • Trigger restart of failed services ? • Collect more information? • SNMP on switches / routers • Environment sensors, UPSs, IPMI, lm_sensors MonALISA for Cluster Monitoring
Thank you for your patience! • http://monalisa.caltech.edu/ • ApMon, Service and Repository • http://lxgrid2.gsi.de:8080/ • GSI repository • http://alimonitor.cern.ch/ • ALICE monitoring • http://repository.uslhcnet.org/ • USLHCNet MonALISA for Cluster Monitoring