Download
1 / 1
10 likes | 128 Views
CD3 positive cell counts. nLBA. nLBA. LBA. LBA. (/mm. (/mm. (/mm. ). ). ). 45. 45. 2. 2. 2. 1400. 1400. 1400. 1400. NS. 40. 40. 35. 35. 1200. 1200. 1200. 1200. *. 30. 30. 1000. 1000. 1000. 1000. 25. 25. 800. 800. 800. 800. 20. 20. 600. 600. 600. 600.

E N D
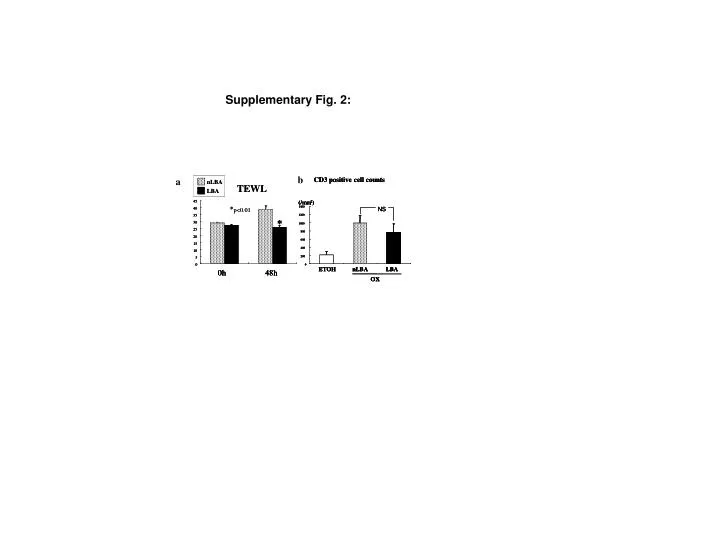
CD3 positive cell counts nLBA nLBA LBA LBA (/mm (/mm (/mm ) ) ) 45 45 2 2 2 1400 1400 1400 1400 NS 40 40 35 35 1200 1200 1200 1200 * 30 30 1000 1000 1000 1000 25 25 800 800 800 800 20 20 600 600 600 600 15 15 400 400 400 400 10 10 200 200 200 200 5 5 0 0 0 0 0 0 ETOH ETOH nLBA nLBA LBA LBA 0h 0h 48h 48h OX OX Supplementary Fig. 2: b CD3 positive cell counts CD3 positive cell counts a nLBA nLBA TEWL TEWL LBA LBA (/mm (/mm ) ) 45 45 2 2 * * 1400 1400 NS NS 40 40 p<0.01 p<0.01 35 35 1200 1200 * * 30 30 1000 1000 25 25 800 800 20 20 600 600 15 15 400 400 10 10 200 200 5 5 0 0 0 0 ETOH ETOH nLBA nLBA LBA LBA 0h 0h 48h 48h OX OX