Download
1 / 8
80 likes | 87 Views
The present study has based on the analysis of drinking water quality parameters A Case Study Of Hanumangarh Town Due to the human and industries activities the water is contaminated. This is serious problem now a day. Thus the analysis of water quality is very important to preserve and perfect the natural eco system. The assessment of water quality index WQI for the drinking water of Hanumangarh Town, district Hanumangarh Rajasthan . The present work is aimed at assessing the analysis drinking water quality of Hanumangarh Town. The water samples of all the selected stations from the wards were collected for the physicochemical analysis. For calculating present water quality status by statistical evaluation and water quality index, following 9 parameters have been considered pH, Taste, Chloride, Total Hardness, Turbidity, Odour, Taste, colour, Temperature. The obtain results are compared with Indian standard drinking water quality specification IS 10500 2012. The study of physicochemical characteristics of this water sample suggested that the evaluation of water quality parameters as well as quality management should be carried out periodically to protect the water resources. Canals IGNP, Bhakhra canals are flowing through Hanumangarh district in Rajasthan. Water quality Parameters of these canals were analyzed in 2017 2018. Although the parameters, equality values are notice in same station. Shivam Vasudev | Dr. Bharat Nagar | Mr. Mukesh Choudhary "Analysis Of Drinking Water Quality Parameters (A Case Study Of Hanumangarh Town)" Published in International Journal of Trend in Scientific Research and Development (ijtsrd), ISSN: 2456-6470, Volume-2 | Issue-5 , August 2018, URL: https://www.ijtsrd.com/papers/ijtsrd15774.pdf Paper URL: http://www.ijtsrd.com/engineering/environment-engineering/15774/analysis-of-drinking-water-quality-parameters-a-case-study-of-hanumangarh-town/shivam-vasudev<br>

E N D
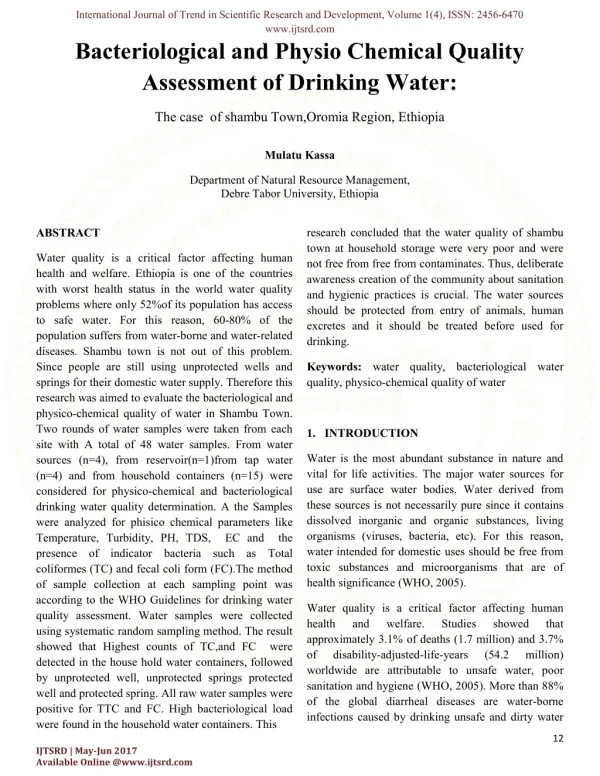
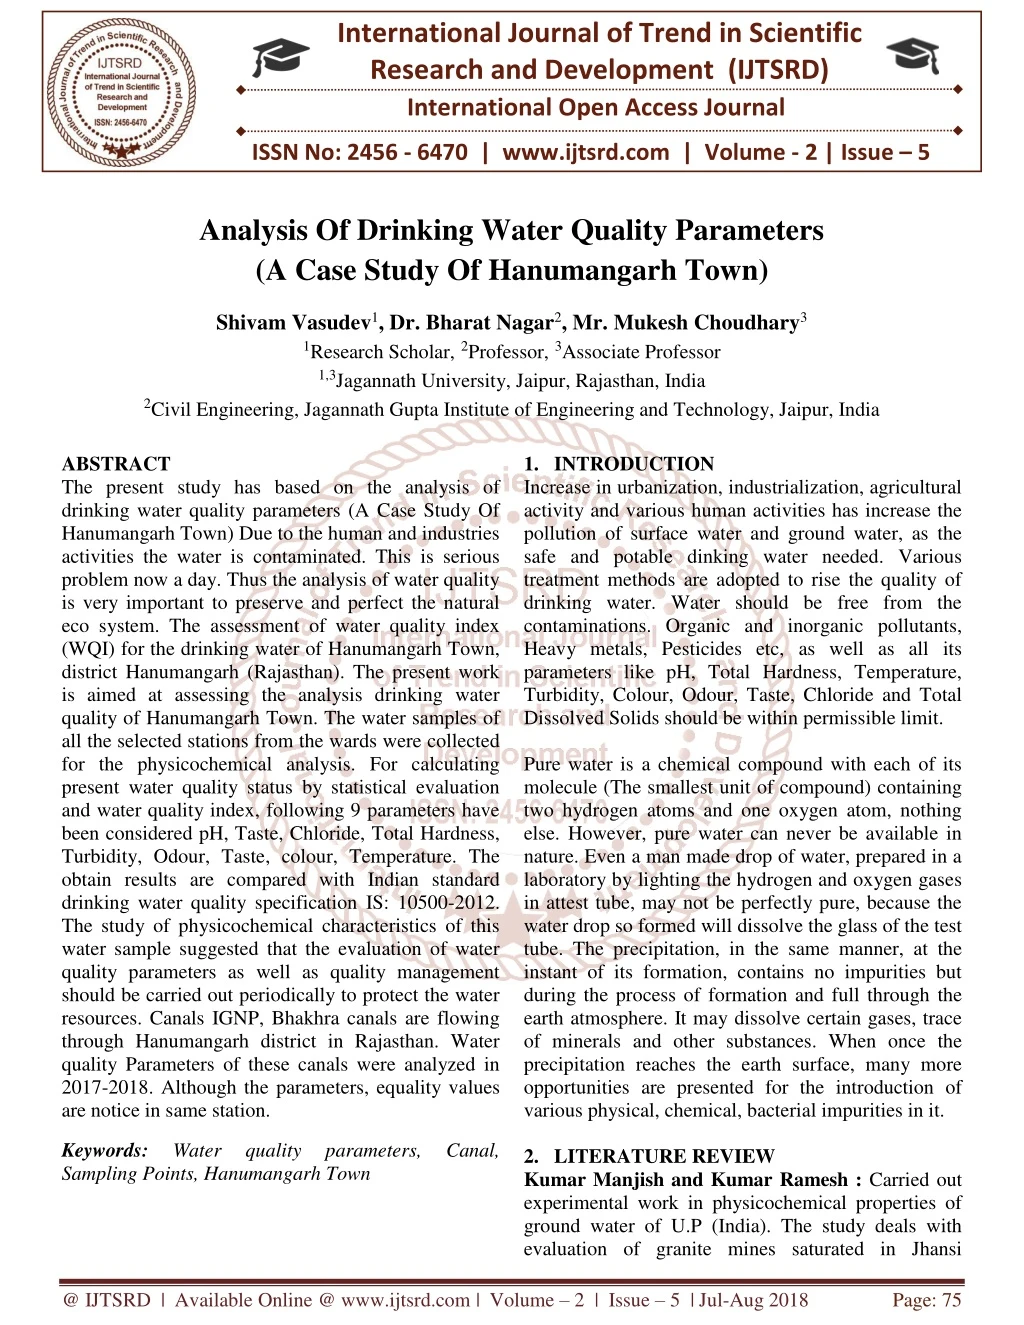
International Journal of Trend in Scientific Research and Development (IJTSRD) International Open Access Journal ISSN No: 2456 - 6470 | www.ijtsrd.com | Volume - 2 | Issue – 5 Analysis Of Drinking Water Quality Parameters (A Case Study Of Hanumangarh Town) Shivam Vasudev1, Dr. Bharat Nagar2, Mr. Mukesh Choudhary3 1Research Scholar,2Professor,3Associate Professor 1,3Jagannath University, Jaipur, Rajasthan, India 2Civil Engineering, Jagannath Gupta Institute of Engineering and Technology, Jaipur, India 1.INTRODUCTION Increase in urbanization, industrialization, agricultural activity and various human activities has increase the pollution of surface water and ground water, as the safe and potable dinking water needed. Various treatment methods are adopted to rise the quality of drinking water. Water should be free from the contaminations. Organic and inorganic pollutants, Heavy metals, Pesticides etc, as well as all its parameters like pH, Total Hardness, Temperature, Turbidity, Colour, Odour, Taste, Chloride and Total Dissolved Solids should be within permissible limit. Pure water is a chemical compound with each of its molecule (The smallest unit of compound) containing two hydrogen atoms and one oxygen atom, nothing else. However, pure water can never be available in nature. Even a man made drop of water, prepared in a laboratory by lighting the hydrogen and oxygen gases in attest tube, may not be perfectly pure, because the water drop so formed will dissolve the glass of the test tube. The precipitation, in the same manner, at the instant of its formation, contains no impurities but during the process of formation and full through the earth atmosphere. It may dissolve certain gases, trace of minerals and other substances. When once the precipitation reaches the earth surface, many more opportunities are presented for the introduction of various physical, chemical, bacterial impurities in it. 2. LITERATURE REVIEW Kumar Manjish and Kumar Ramesh : Carried out experimental work in physicochemical properties of ground water of U.P (India). The study deals with evaluation of granite mines saturated in Jhansi ABSTRACT The present study has based on the analysis of drinking water quality parameters (A Case Study Of Hanumangarh Town) Due to the human and industries activities the water is contaminated. This is serious problem now a day. Thus the analysis of water quality is very important to preserve and perfect the natural eco system. The assessment of water quality index (WQI) for the drinking water of Hanumangarh Town, district Hanumangarh (Rajasthan). The present work is aimed at assessing the analysis drinking water quality of Hanumangarh Town. The water samples of all the selected stations from the wards were collected for the physicochemical analysis. For calculating present water quality status by statistical evaluation and water quality index, following 9 parameters have been considered pH, Taste, Chloride, Total Hardness, Turbidity, Odour, Taste, colour, Temperature. The obtain results are compared with Indian standard drinking water quality specification IS: 10500-2012. The study of physicochemical characteristics of this water sample suggested that the evaluation of water quality parameters as well as quality management should be carried out periodically to protect the water resources. Canals IGNP, Bhakhra canals are flowing through Hanumangarh district in Rajasthan. Water quality Parameters of these canals were analyzed in 2017-2018. Although the parameters, equality values are notice in same station. Keywords: Sampling Points, Hanumangarh Town Water quality parameters, Canal, @ IJTSRD | Available Online @ www.ijtsrd.com | Volume – 2 | Issue – 5 | Jul-Aug 2018 Page: 75
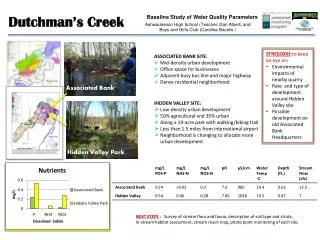
International Journal of Trend in Scientific Research and Development (IJTSRD) ISSN: 2456-6470 (goramachia) for their status about physico, chemical contamination of ground water. Six different sites are selected for sample testing collected from mines and urban area. Three samples have been taken at various distances on the site. This location is 10 km about from Jhansi city. The physicochemical parameters such as pH, Turbidity, DO, Temperature, Colour have been tested. It has been found that parameters are not in limit when compared with WHO standards. Tyagi Shewta, Sharma Bhavtosh: Carried out water quality assessment in terms of water quality index at Uttrakhand (India). The study state that water quality index is valuable and unique rating to depict the overall water quality status in a single term that is helpful of selection of appropriate helpful technique to meet the concerned issue. However, WQI depicts the composite influence of different water quality parameters and communicates information to the public and legislative decision makers. In spite of absence of a globally accepted composite index of water quality, some countries have used and are using aggregated water quality data in the development of water quality indices. Attempts hve been made to review the WQI criteria for the appropriateness of drinking water resources. Besides, the present articles also highlights and draw attention towards the development of a new and globally accepted. “Water Quality Index” in a specified format, which may be used at large and could represent reliable picture of water quality. Initially WQI selecting 10 most commonly used water quality variables like Dissolved oxygen, pH, TDS, Colour, Temperature has been widely applied and accepted European, African and Asian countries. Dr. N. C. Gupta, Ms. Shikha Bhist and Mr. B. A. Patra: Carried out physicochemical analysis of drinking water quality from 32 locations in Delhi. Delhi is an old town. Which has gradually grown in to a popular city. It is one of the important business centres of India and thickly populated as well. Since the last decade, drinking water problem has created havoc in the city. In this study, we collected 32 drinking water samples throughout Delhi, Different parameters were examined using Indian Standards to find out their suitability for drinking purposes. During this examination mainly parameters were taken in to consideration. Ramkrishna Ch: Carried out studies on ground water status by water Vishkhapattanam (India). Commensurate with the growth of industrial and allied activities in and around Visakhapatanam city, its area grew from 30km2 in 1960 to over 80km2 to date. The city’s population according to 2001 census is about 1.33 million. Water supply has always been inadequate in this city with the crisis growing along with the cities progress, Today’s water requirement is 360 million gallons per day. The existing Meghadrigadda and Mudasarlovcan hardly 50% of the need. Rajwada water scheme can add a little more, therefore the supply capacity needs to be augmented. The only viable solution is to transport water from Godavari, apart from the municipal supply the population also depends upon the ground water reservoirs, groundwater quality of southern India is strongly dependent on bedrock geology and climate but may also be impacted in parts by pollution, particularly from agricultural and industrial sources. 3. MATERIAL AND METHODS I. Study Area: The surface water and underground water of Hanumangarh Town is used for agricultural as well as drinking purpose. In the present study many water samples were taken from different different areas from Hanumangarh Town and saw the changes in water quality parameters from source point to destination (Canal→ Water Wokas→ Tap Water). II. The Sampling Points: ➢ Indira Gandhi Canal ➢ Source point (Water wokas). ➢ Site area (Tap water). III. Sample Collection: Potable water samples were collected from canal system of Northen Rajasthan (Indira Gandhi & Bhakra canal). These samples were collected in sterile capped containers. To avoid contamination disposable glove washed with HCl (1N) were worn during water sampling. The water containers were kept in air tight large plastic ice-cold containers and were transported to Bio technology lab within 12 hours for the further processing. IV. Study Periods: The study was carried out in a period of 5 months that is December, 2017, to May, 2018. The study started with the collection of water samples from the different-different areas from Hanumangarh town, with the help of sterilised test tubes. For the chemical Thatipudi, Gossthani, water quality the physicochemical quality index at @ IJTSRD | Available Online @ www.ijtsrd.com | Volume – 2 | Issue – 5 | Jul-Aug 2018 Page: 76
International Journal of Trend in Scientific Research and Development (IJTSRD) ISSN: 2456-6470 I. Temperature: The temperature of water reveals almost uniform magnitude in all the study samples and it is lying from tap water (96.20 F-97.0 F) canal water (94.80 F-96.40 F) and source point water (96.0 F-98.20 F). The fluctuations in optimum temperature may lead on increases and decreases on the change of weather, results are shown in table No2 and chart No1. Table 2: Temperature Results of water sample Water temperature in sector-1 (Punjabi mohalla) Sr. No. Tap water Canal water 1. 97.40 F 94.80 F Water temperature in sector-2 (Ward No 21) Sr. No. Tap water Canal water 1. 96.20 F 95.7 F Water temperature in sector-3 (Nai Abadi) Sr. No. Tap water Canal water 1. 96.30 F 95.90 F Water temperature in sector-4 (Professor Colony) Sr. No. Tap water Canal water 1. 97.00 F 96.40 F Water temperature in sector-5 (Sector-3) Sr. No. Tap water Canal water 1. 96.80 F 95.80 F Water temperature in sector-6 (Main Bazar) Sr. No. Tap water Canal water 1. 96.20 F 95.70 F Water temperature in sector-7 (Indra Colony) Sr. No. Tap water Canal water 1. 96.30 F 95.90 F and physical sampling, water samples were brought to the laboratory in clean sterile test tubes and analysed with in 12 hr. These samples were taken from common water sources that is where the hole Hanumangarh Town gets its water supply. So, testing water samples from these common sources like (Canal, Water wokas, tap water), would serve the purpose and save resources. 4. PHYSICO-CHEMICAL ANALYSIS: For the analyzed of drinking water quality parameters of the Hanumangarh Town, the physicochemical parameters which were analyzed include pH, Chloride, Temperature, Total Hardness, Colour, Taste, Odour, Turbidity, TDS (Total Dissolved Solids). I. Parameters Included Assessment: Analysis of drinking water quality parameters at Hanumangarh Town requires many parameters to be sampled. The parameters analyzed in this assessment include: Table 1: Standard values of water sample S. No. 1 Colour Unobjectionable IS: 10500 2 Taste Agreeable 3 pH 6.5 – 7.5 4 Turbidity 5 5 TDS 500 6 TSS 5 7 BOD Nil – 5 8 DO 4 – 6 9 Total Hardness 10 Chloride 250 11 Alkalinity 120 12 Residual Chlorine (Except pH and Turbidity values other parameters are in mg/L) USPHS Standards for United States Public Health Service. 5. RESULTS AND DISCUSSION: In order to explore physicochemical study of drinking water quality parameters in different areas at Hanumangarh Town in Hanumangarh district, Rajasthan. Experiment were conducted and observed with respect to the analysis of physicochemical parameters. Source point 98.20 F Source point 96.10 F In Water Quality Source point 96.0 F Source point 96.20 F Parameters Permissible Value Standard Source point 96.10 F IS: 10500 IS: 10500 IS: 10500 IS: 10500 USPHS USPHS USPHS IS: 10500 Source point 95.80 F Source point 96.00 F 300 IS: 10500 USPHS IS: 10500 0.2 Chart 1: Graphical representation of temperature (Degree F˚) II. Total Hardness: As per IS: 10500-2012. Desirable limit and permissible limit for hardness is lies between 200 to 600 mg/l respectively. The degree of hardness of @ IJTSRD | Available Online @ www.ijtsrd.com | Volume – 2 | Issue – 5 | Jul-Aug 2018 Page: 77
International Journal of Trend in Scientific Research and Development (IJTSRD) ISSN: 2456-6470 drinking water has been classified in terms of the equivalent CaCo3 concentration as follows: Table 3: Standard values of drinking water hardness Hardness Mg/l 0-17 17-60 60-120 120>180 180 The hardness of water reveals almost uniform magnitude in all the study samples and it is lying from tap water (14-19) mg/l canal water (19-22) mg/l and source point water (13-16) mg/l. The results are shows in table No4 and Chart No2 Table 4: Hardness results of water sample Water Hardness in sector-1 (Punjabi mohalla) Sr. No. Tap water Canal water Source point 1. 15 Water Hardness in sector-2 (Ward No 21) Sr. No. Tap water Canal water Source point 1. 16.20 Water Hardness in sector-3 (Nai Abadi) Sr. No. Tap water Canal water Source point 1. 14.70 Water Hardness in sector-4 (Professor Colony) Sr. No. Tap water Canal water Source point 1. 16.50 Water Hardness in sector-5 (Sector-3) Sr. No. Tap water Canal water Source point 1. 18.10 Water Hardness in sector-6 (Main Bazar) Sr. No. Tap water Canal water Source point 1. 17.20 Water Hardness in sector-7 (Indra Colony) Sr. No. Tap water Canal water Source point 1. 16.90 The hardness is in mg/l Type Soft Slightly Hard Moderating Hard Hard Very Hard Chart 2: Graphical representation of hardness The hardness is in mg/l III. Turbidity: The standard turbidity is 5 NTU. Measurement of turbidity reflects the temporary in water. It is caused by the substances present in water in suspension. In natural water, it is caused by clay, salts, slit, organic matter in organic matter and other microscopic organism. It is range from less than 2 NTU is excellent. However the prescribed limit is 5 NTU (IS: 10500). We can see the turbidity within our simple eyes. Turbidity was found within permissible limit the results are shown table No5 and chart no 3. Table 5: Turbidity results of water sample Water Turbidity in sector-1 (Punjabi mohalla) Sr. No. Tap water Canal water Source point 1. 0.80 1.85 Water Turbidity in sector-2 (Ward No 21) Sr. No. Tap water Canal water Source point 1. 0.80 1.85 Water Turbidity in sector-3 (Nai Abadi) Sr. No. Tap water Canal water Source point 1. 1.0 3.5 Water Turbidity in sector-4 (Professor Colony) Sr. No. Tap water Canal water Source point 1. 0.87 2.87 Water Turbidity in sector-5 (Sector-3) Sr. No. Tap water Canal water Source point 1. 0.85 2.45 Water Turbidity in sector-6 (Main Bazar) Sr. No. Tap water Canal water Source point 1. 0.80 2.10 Water Turbidity in sector-7 (Indra Colony) Sr. No. Tap water Canal water Source point 1. 1.20 1.80 Turbidity unit is NTU (Nephelo matric turbidity unit) 20 13.80 19.50 14.30 19.10 14.00 22.0 15.20 0.60 21.80 15.90 0.60 21.90 14.90 1.10 20.90 15.10 0.75 1.20 1.15 1.40 @ IJTSRD | Available Online @ www.ijtsrd.com | Volume – 2 | Issue – 5 | Jul-Aug 2018 Page: 78
International Journal of Trend in Scientific Research and Development (IJTSRD) ISSN: 2456-6470 Chart 3: Graphical representation of turbidity Chart 4: Graphical Representation Of pH of water V. TDS: (Total Dissolved Solids): Table 7: Standard value of TDS Less then 300 300-600 600-900 900-1200 1200-1500 Total dissolved solids may be considered as salinity indicator for classification of groundwater. The TDS in groundwater is due to the presence of calcium, magnesium, sodium, potassium, bicarbonate, chloride ions. In the study area TDS varies from tap water (500-550) mg/l, canal water (550-620) mg/l, and source point (530-570) mg/l, All the water samples have TDS concentration was under the prescribed limit. The results have shown in table N0 8 and chart No 4. Table 8: TDS results of water sample TDS in sector-1 (Punjabi mohalla) Sr. No. Tap water Canal water 1. 510 TDS in sector-2 (Ward No 21) Sr. No. Tap water Canal water Source point 1. 525 TDS in sector-3 (Nai Abadi) Sr. No. Tap water Canal water Source point 1. 512 TDS in sector-4 (Professor Colony) Sr. No. Tap water Canal water Source point 1. 524 TDS in sector-5 (Sector-3) Sr. No. Tap water Canal water Source point 1. 502 TDS in sector-6 (Main Bazar) Sr. No. Tap water Canal water Source point 1. 520 IV. pH: The standard range of pH is 6.5-8.5. The pH is measure of the intensity of acidity and measure of the concentration of hydrogen ions in water. Below 4.0 will produce sour taste and higher than 8.5 shows alkaline taste. The results shown in table No 4 and chart No 4. Table 6: pH results of water sample The pH in sector-1 (Punjabi mohalla) Sr. No. Tap water Canal water Source point 1. 7.01 The pH in sector-2 (Ward No 21) Sr. No. Tap water Canal water Source point 1. 7.10 The pH in sector-3 (Nai Abadi) Sr. No. Tap water Canal water Source point 1. 7.20 The pH in sector-4 (Professor Colony) Sr. No. Tap water Canal water Source point 1. 7.0 The pH in sector-5 (Sector-3) Sr. No. Tap water Canal water Source point 1. 7.30 The pH in sector-6 (Main Bazar) Sr. No. Tap water Canal water Source point 1. 7.10 The pH in sector-7 (Indra Colony) Sr. No. Tap water Canal water Source point 1. 7.10 Excellent Good Fair Poor Not Desirable 5.7 6.70 8.40 6.30 6.10 7.40 Source point 540 8.10 6.70 615 8.0 7.0 595 547 7.70 6.80 602 552 8.10 6.70 622 574 559 543 610 570 @ IJTSRD | Available Online @ www.ijtsrd.com | Volume – 2 | Issue – 5 | Jul-Aug 2018 Page: 79
International Journal of Trend in Scientific Research and Development (IJTSRD) ISSN: 2456-6470 TDS in sector-7 (Indra Colony) Sr. No. Tap water Canal water Source point 1. 500 Odour results in sector-1 (Punjabi mohalla) Sr. No. Tap water Canal water Source point 1. Odour less Mostly Odour Odour results in sector-2 (Ward No 21) Sr. No. Tap water Canal water Source point 1. Odour less Mostly Odour Odour results in sector-3 (Nai Abadi) Sr. No. Tap water Canal water Source point 1. Odour less Mostly Odour Taste results in sector-4 (Professor Colony) Sr. No. Tap water Canal water Source point 1. Odour less Mostly Odour Odour results in sector-5 (Sector-3) Sr. No. Tap water Canal water Source point 1. Odour less Slightly Odour results in sector-6 (Main Bazar) Sr. No. Tap water Canal water Source point 1. Odour less Mostly Odour Odour results in sector-7 (Indra Colony) Sr. No. Tap water Canal water Source point 1. Odour less Slightly VIII. Colour: Basically colour is identified with eyes view. The colour of water with the ambient conditions in which that water is present. While relatively small quantities of water appear to be colourless. Colour is appeared due to the reason of dissolved and suspended components. Table-11: Colour results of water sample Colour results in sector-1 (Punjabi mohalla) Sr. No. Tap water Canal water Source point 1. Colour less Yellowish Colour results in sector-2 (Ward No 21) Sr. No. Tap water Canal water Source point 1. Colour less Yellowish Colour results in sector-3 (Nai Abadi) Sr. No. Tap water Canal water Source point 1. Colour less Brownish Colour results in sector-4 (Professor Colony) Sr. No. Tap water Canal water Source point 1. Colour less Yellowish Colour results in sector-5 (Sector-3) Sr. No. Tap water Canal water Source point 1. Colour less Colour results in sector-6 (Main Bazar) Sr. No. Tap water Canal water 1. Colour less Brownish Colour results in sector-7 (Indra Colony) Sr. No. Tap water Canal water Source point 1. Colour less 580 545 Slightly Slightly Slightly Odour less Odour less Chart 5: Graphical Representation of TDS of water VI. Taste: Basically taste is inoffensive. Odour less Odour less Table 9: Taste results of water sample Taste results in sector-1 (Punjabi mohalla) Sr. No. Tap water Canal water Source point 1. Tasteless Desirable Taste results in sector-2 (Ward No 21) Sr. No. Tap water Canal water Source point 1. Tasteless Desirable Taste results in sector-3 (Nai Abadi) Sr. No. Tap water Canal water Source point 1. Tasteless Desirable Taste results in sector-4 (Professor Colony) Sr. No. Tap water Canal water Source point 1. Tasteless Desirable Taste results in sector-5 (Sector-3) Sr. No. Tap water Canal water Source point 1. Tasteless Desirable Taste results in sector-6 (Main Bazar) Sr. No. Tap water Canal water Source point 1. Tasteless Desirable Taste results in sector-7 (Indra Colony) Sr. No. Tap water Canal water Source point 1. Tasteless Desirable Tasteless Tasteless Tasteless Colour less Tasteless Colour less Tasteless Colour less Tasteless Colour less Tasteless Sandy Colour less VII. Odour: Basically odour is inoffensive. An odour is always caused by one or more compounds. Table 10: Odour results of water sample Source point Colour less Sandy Colour less @ IJTSRD | Available Online @ www.ijtsrd.com | Volume – 2 | Issue – 5 | Jul-Aug 2018 Page: 80
International Journal of Trend in Scientific Research and Development (IJTSRD) ISSN: 2456-6470 IX. Chloride: In the study area there is much changes in different- different samples it is ranged tap water (67-75) mg/l, canal water (54-68) mg/l, source point (65-82) mg/l. The permissible value is under the 250 mg/l. Table 12: Chloride results of water sample Chloride results in sector-1 (Punjabi mohalla) Sr. No. Tap water Canal water Source point 1. 74 Chloride results in sector-2 (Ward No 21) Sr. No.Tap water Canal water Source point 1. 77 Chloride results in sector-3 (Nai Abadi) Sr. No.Tap water Canal water Source point 1. 69 Chloride results in sector-4 (Professor Colony) Sr. No. Tap water Canal water Source point 1. 71 samples characteristics of water samples at different locations of Hanumangarh city. The nine parameters were analyzed different different seven locations. The following results can be draw with the current study was: ➢It was observe the all the almost parameters in permissible limits. ➢Some where the pH concentration goes low. ➢In the month of April water got turbulence due to the polluted water from industries from Punjab state. ➢Sometimes water temperature increase due to the impurities of water CO2 had increased. ➢The water parameter (TDS) in totally under the permissible limit. The outcome of the study can help a develop water quality awareness culture and practice in present as well as in future generation. So this study will helpful to many water quality analysts as ell as biologist, environmentalists also very useful to Public Health department and Municipal corporation to improve public health in epidemiological issues. REFERENCES: 1.Kumar Manjish and Kumar Ramesh, Assessment of Physico-Chemical properties of ground water in granite mining area in Goramachia, Jhansi, 2(1).19-24,(2013). 2.Ramakrishna C. and el. at, Studies on ground water quality in slums of Visakapatnam, Asian journal of chemistry, 21(6), 4246-4250(2009). 3.Kavitha. R and Elangovan K., Review article on ground water characteristics at Erode district, (India), of I.J.E.S., 1 (3),34-38(2013). 4.Manual on water and waste water analysis, National Environment Engineering Research Institute, Nagpur (1988) 5.Muthukumaravel K. and et.al, Evaluation of ground water quality in Perambalur, Indian journal of environmental science 14(1), 47-49 (2010). 6.Standard APHA methods for the examination of water 22nd edition (2012) 7.Beuro of standards for drinking water 2012(BIS 2012) 2012. and analysis of physicochemical 54 82 59 82 57 79 55 75 ecologist and Chloride results in sector-5 (Sector-3) Sr. No. Tap water Canal water Source point 1. 74 Chloride results in sector-6 (Main Bazar) Sr. No.Tap water Canal water Source point 1. 68 Chloride results in sector-7 (Indra Colony) Sr. No.Tap water Canal water Source point 1. 75 62 71 64 65 67 71 100 80 60 40 20 0 Tap water Canal Water Source point Chart 6: Graphical representation of chlorides of water 6. CONCLUSION Water quality is dependent on the type of pollutant added and the nature and mineral found in particular zone of drinking water. Monitoring of drinking water quality of is done by collecting representative water @ IJTSRD | Available Online @ www.ijtsrd.com | Volume – 2 | Issue – 5 | Jul-Aug 2018 Page: 81
International Journal of Trend in Scientific Research and Development (IJTSRD) ISSN: 2456-6470 8.Rambai Evaluation of water quality index and computation of environmental health indicators case study S.G.S.I.T.S. Indore (2013). 9.Niranjan K. and et. Al, Ground water quality assessment of Wailpalli Nalgonda, Indian journal of environmental sciences, 15(1), 69-76(2011). 10.Gupta N. and et.al physic-chemical analysis of drinking water quality from 32 locations in Delhi journal of Indian water works association (2010). Wahatuti, Dissertation Phase-1 @ IJTSRD | Available Online @ www.ijtsrd.com | Volume – 2 | Issue – 5 | Jul-Aug 2018 Page: 82