Download
1 / 6
60 likes | 69 Views
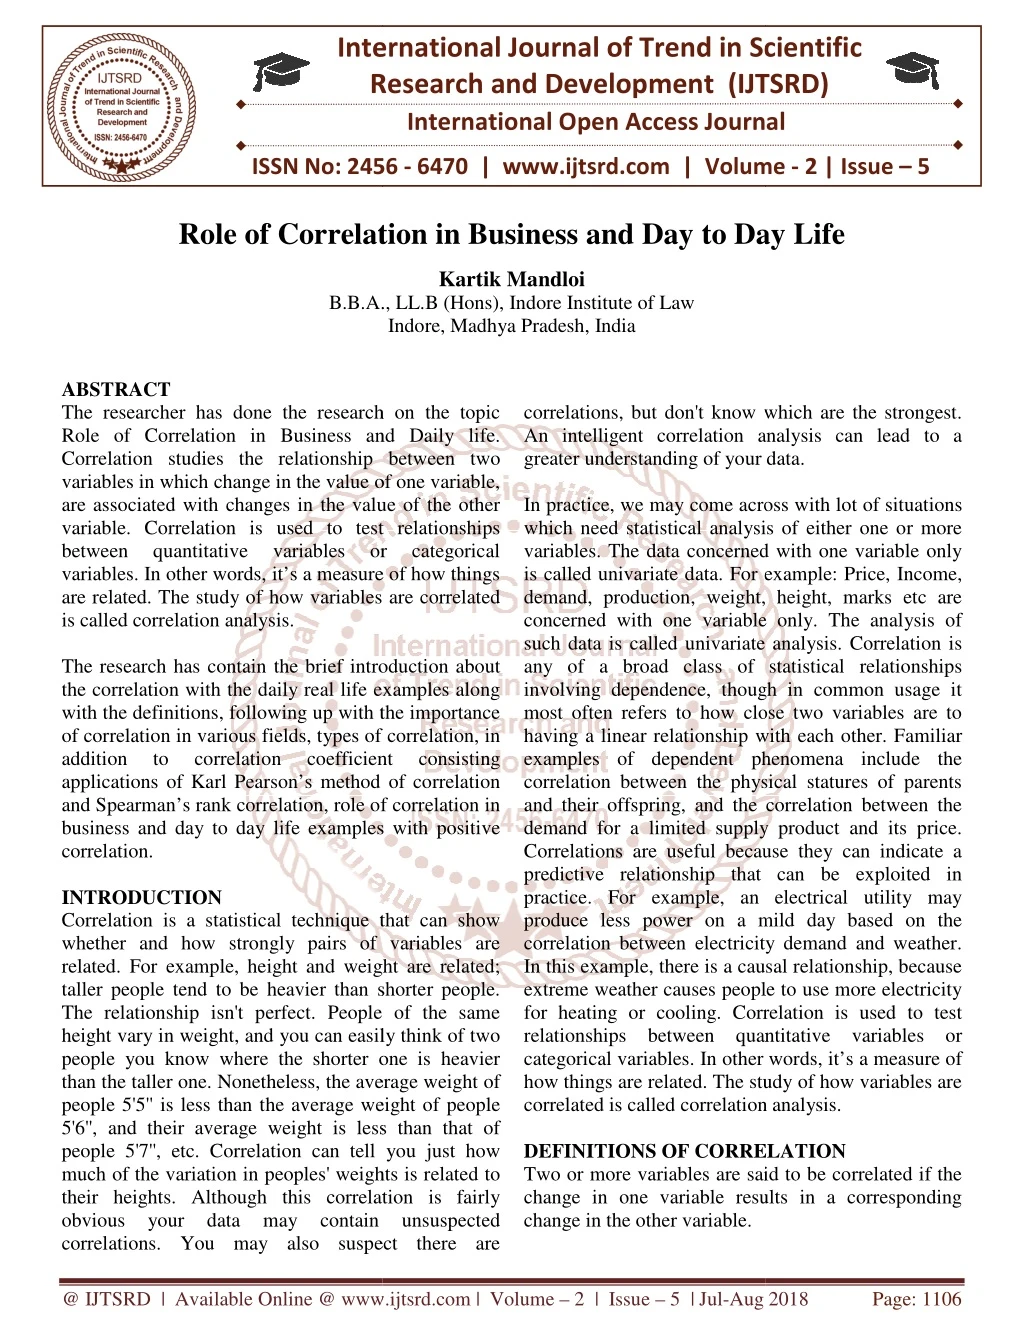
The researcher has done the research on the topic Role of Correlation in Business and Daily life. Correlation studies the relationship between two variables in which change in the value of one variable, are associated with changes in the value of the other variable.Correlation is used to test relationships between quantitative variables or categorical variables. In other words, it's a measure of how things are related. The study of how variables are correlated is called correlation analysis.The research has contain the brief introduction about the correlation with the daily real life examples along with the definitions, following up with the importance of correlation in various fields, types of correlation, in addition to correlation coefficient consisting applications of Karl Pearson's method of correlation and Spearman's rank correlation, role of correlation in business and day to day life examples with positive correlation. Kartik Mandloi "Role of Correlation in Business and Day to Day Life" Published in International Journal of Trend in Scientific Research and Development (ijtsrd), ISSN: 2456-6470, Volume-2 | Issue-5 , August 2018, URL: https://www.ijtsrd.com/papers/ijtsrd17043.pdf Paper URL: http://www.ijtsrd.com/management/law-and-management/17043/role-of-correlation-in-business-and-day-to-day-life/kartik-mandloi<br>

E N D
International Research Research and Development (IJTSRD) International Open Access Journal Role of Correlation in Business and Day to Day Life International Journal of Trend in Scientific Scientific (IJTSRD) International Open Access Journal ISSN No: 2456 ISSN No: 2456 - 6470 | www.ijtsrd.com | Volume 6470 | www.ijtsrd.com | Volume - 2 | Issue – 5 Role of Correlation in Business and Day t o Day Life Kartik Mandloi B.B.A., B.B.A., LL.B (Hons), Indore Institute of Law Indore, Madhya Pradesh, India ABSTRACT The researcher has done the research Role of Correlation in Business and Daily life. Correlation studies the relationship between two variables in which change in the value of one variable, are associated with changes in the value of the other variable. Correlation is used to test relationships between quantitative variables variables. In other words, it’s a measure of how things are related. The study of how variables are correlated is called correlation analysis. The research has contain the brief introduction a the correlation with the daily real life examples along with the definitions, following up with the importance of correlation in various fields, types of correlation, in addition to correlation applications of Karl Pearson’s method of correlation and Spearman’s rank correlation, role of correlation in business and day to day life examples with positive correlation. INTRODUCTION Correlation is a statistical technique that can show whether and how strongly pairs of variables are related. For example, height and weight are related; taller people tend to be heavier than shorter people. The relationship isn't perfect. People of the same height vary in weight, and you can easily think of two people you know where the shorter one is hea than the taller one. Nonetheless, the average weight of people 5'5'' is less than the average weight of people 5'6'', and their average weight is less than that of people 5'7'', etc. Correlation can tell you just how much of the variation in peoples' weights is related to their heights. Although this correlation is fairly obvious your data may contain unsuspected correlations. You may also suspect there are correlations. You may also suspect there are correlations, but don't know which are the strongest. An intelligent correlation analysis greater understanding of your data. In practice, we may come across with lot of situations which need statistical analysis of either one or more variables. The data concerned with one variable only is called univariate data. For example: Pri demand, production, weight, height, marks etc are concerned with one variable only. The analysis of such data is called univariate analysis. Correlation is any of a broad class of statistical relationships involving dependence, though in common most often refers to how close two variables are to having a linear relationship with each other. Familiar examples of dependent phenomena include the correlation between the physical statures of parents and their offspring, and the correlation b demand for a limited supply product and its price. Correlations are useful because they can indicate a predictive relationship that can be exploited in practice. For example, an electrical utility may produce less power on a mild day based on th correlation between electricity demand and weather. In this example, there is a causal relationship, because extreme weather causes people to use more electricity for heating or cooling. Correlation is used to test relationships between quantitative vari categorical variables. In other words, it’s a measure of how things are related. The study of how variables are correlated is called correlation analysis. DEFINITIONS OF CORRELATION Two or more variables are said to be correlated if the change in one variable results in a corresponding change in the other variable. The researcher has done the research on the topic Role of Correlation in Business and Daily life. Correlation studies the relationship between two variables in which change in the value of one variable, are associated with changes in the value of the other correlations, but don't know which are the strongest. An intelligent correlation analysis can lead to a greater understanding of your data. In practice, we may come across with lot of situations which need statistical analysis of either one or more variables. The data concerned with one variable only is called univariate data. For example: Price, Income, demand, production, weight, height, marks etc are concerned with one variable only. The analysis of such data is called univariate analysis. Correlation is any of a broad class of statistical relationships involving dependence, though in common usage it most often refers to how close two variables are to having a linear relationship with each other. Familiar examples of dependent phenomena include the correlation between the physical statures of parents and their offspring, and the correlation between the demand for a limited supply product and its price. Correlations are useful because they can indicate a predictive relationship that can be exploited in practice. For example, an electrical utility may produce less power on a mild day based on the correlation between electricity demand and weather. In this example, there is a causal relationship, because extreme weather causes people to use more electricity Correlation is used to test relationships between quantitative variables or categorical variables. In other words, it’s a measure of how things are related. The study of how variables are correlated is called correlation analysis. st relationships between variables. In other words, it’s a measure of how things are related. The study of how variables are correlated quantitative variables or or categorical categorical The research has contain the brief introduction about the correlation with the daily real life examples along with the definitions, following up with the importance of correlation in various fields, types of correlation, in addition to correlation coefficient coefficient hod of correlation consisting consisting and Spearman’s rank correlation, role of correlation in business and day to day life examples with positive Correlation is a statistical technique that can show whether and how strongly pairs of variables are elated. For example, height and weight are related; taller people tend to be heavier than shorter people. The relationship isn't perfect. People of the same height vary in weight, and you can easily think of two people you know where the shorter one is heavier than the taller one. Nonetheless, the average weight of people 5'5'' is less than the average weight of people 5'6'', and their average weight is less than that of people 5'7'', etc. Correlation can tell you just how DEFINITIONS OF CORRELATION Two or more variables are said to be correlated if the in one variable results in a corresponding weights is related to Although this correlation is fairly obvious your data may contain unsuspected @ IJTSRD | Available Online @ www.ijtsrd.com @ IJTSRD | Available Online @ www.ijtsrd.com | Volume – 2 | Issue – 5 | Jul-Aug 2018 Aug 2018 Page: 1106
International Journal of Trend in Scientific Research and Development (IJTSRD) ISSN: 2456-6470 5.The effect of correlation is to reduce the range of uncertainty. The prediction based on correlation analysis is likely to be more variable and near to reality. TYPES OF CORRELATION In a bivariate distribution, the correlation may be: 1. Positive, Negative and Zero Correlation; and 2. Linear or Curvilinear (Non-linear). 1. Positive, Negative or Zero Correlation: When the increase in one variable (X) is followed by a corresponding increase in the other variable (Y); the correlation is said to be positive correlation. The positive correlations range from 0 to +1; the upper limit i.e. +1 is the perfect positive coefficient of correlation. The perfect positive correlation specifies that, for every unit increase in one variable, there is proportional increase in the other. For example “Heat” and “Temperature” have a perfect positive correlation. If, on the other hand, the increase in one variable (X) results in a corresponding decreases in the other variable (Y), the correlation is said to be negative correlation. The negative correlation ranges from 0 to – 1; the lower limit giving the perfect negative correlation. The perfect negative correlation indicates that for every unit increase in one variable, there is proportional unit decrease in the other. Zero correlation means no relationship between the two variables X and Y; i.e. the change in one variable (X) is not associated with the change in the other variable (Y). For example, body weight and intelligence, shoe size and monthly salary; etc. The zero correlation is the mid-point of the range – 1 to + 1. 2. Linear or Curvilinear Correlation: Linear correlation is the ratio of change between the two variables either in the same direction or opposite direction and the graphical representation of the one variable with respect to other variable is straight line. Consider another situation. First, with increase of one variable, the second variable increases proportionately upto some point; after that with an increase in the first variable the second variable starts decreasing. According to Simpson and Kafka, “Correlation analysis deals with the association between two or more variables”. Lunchou defines, “Correlation analysis attempts to determine the degree of relationship between variables”. Boddingtons states that “Whenever some definite connection exists between two or more groups or classes of series of data, there is said to be correlation.” In nut shell, correlation analysis is an analysis which helps to determine the degree of relationship exists between two or more variables. IMPORTANCE OF CORRELATION Meaning of Correlation studies the relationship between two variables in which change in the value of one variable, are associated with changes in the value of the other variable. For example, as the summer heat rises, hill stations are crowded with more and more visitors. Ice-cream sales become more brisk. Thus, the temperature is related to number of visitors and sale, of ice-creams. Importance of Correlation 1.Most of the variables show some kind of relationship. For instance, there is relationship between price and supply, income and expenditure etc. With the help of correlation analysis we can measure in one figure the degree of relationship. 2.Once we know that two variables are closely related, we can estimate the value of one variable given the value of another. This is known with the help of regression. 3.Correlation analysis understanding of economic behavior, aids in locating the critically important variables on which others depend. 4.Progressive development in the methods of science and philosophy has been characterized by increase in the knowledge of relationship. In nature also one finds multiplicity of interrelated forces. contributes to the @ IJTSRD | Available Online @ www.ijtsrd.com | Volume – 2 | Issue – 5 | Jul-Aug 2018 Page: 1107
International Journal of Trend in Scientific Research and Development (IJTSRD) ISSN: 2456-6470 The graphical representation of the two variables will be a curved line. Such a relationship between the two variables is termed as the curvilinear correlation. CORRELATION COEFFICIENT A correlation coefficient is a statistical measure of the degree to which changes to the value of one variable predict change to the value of another. In positively correlated variables, the value increases or decreases in tandem. In negatively correlated variables, the value of one increases as the value of the other decreases. Correlation coefficients are expressed as values between +1 and -1. A coefficient of +1 indicates a perfect positive correlation: A change in the value of one variable will predict a change in the same direction in the second variable. A coefficient of -1 indicates a perfect negative correlation: A change in the value of one variable predicts a change in the opposite direction in the second variable. Lesser degrees of correlation are expressed as non-zero decimals. A coefficient of zero indicates there is no discernable relationship between fluctuations of the variables. Correlation coefficients are used in statistics to measure how strong a relationship is between two variables. There are several types of correlation coefficient: Pearson’s correlation Pearson’s R) is a correlation coefficient commonly used in linear regression. If you’re starting out in statistics, you’ll probably learn about Pearson’s R first. In fact, when anyone refers to the correlation coefficient, they are usually talking about Pearson’s. Correlation coefficient formulas are used to find how strong a relationship is between data. The formulas return a value between -1 and 1, where: ?1 indicates a strong positive relationship. ?-1 indicates a strong negative relationship. ?A result of zero indicates no relationship at all. (also called Graphs showing a correlation of -1, 0 and +1 KARL CORRELATION Karl Pearson’s Coefficient of Correlation is the most popular method among the algebraic methods for measuring correlation. This method was developed by Prof. Karl Pearson in 1896. It is called product moment correlation coefficient. Pearson’s coefficient of correlation is defined as the ratio of covariance between X and Y to the product of their standard deviation. This is denoted by ‘r’ or rxy. r = Covariance of X and Y (SD of X) *(SD of Y) PEARSON’S COEFFICIENT OF Formula In order to determine how strong the relationship is between two variables, a formula must be followed to produce what is referred to as the coefficient value. The coefficient value can range between -1.00 and 1.00. If the coefficient value is in the negative range, then that means the relationship between the variables is negatively correlated, or as one value increases, the other decreases. If the value is in the positive range, then that means the relationship between the variables is positively correlated, or both values increase or decrease together. Let's look at the formula for conducting the Pearson correlation coefficient value. Step one: Make a chart with your data for two variables, labeling the variables (x) and (y), and add @ IJTSRD | Available Online @ www.ijtsrd.com | Volume – 2 | Issue – 5 | Jul-Aug 2018 Page: 1108
International Journal of Trend in Scientific Research and Development (IJTSRD) ISSN: 2456-6470 three more columns labeled (xy), (x^2), and (y^2). A simple data chart might look like this: Person Age (x) Score (y) (xy) (x^2) (y^2) 1 2 3 More data would be needed, but only three samples are shown for purposes of example. Step two: Complete the multiplication of the variable values. Person Age (x) Score (y) (xy) (x^2) (y^2) 1 20 30 2 24 20 3 17 27 Step three: After you have multiplied all the values to complete the chart, add up all of the columns from top to bottom. Person Age (x) Score (y) (xy) (x^2) (y^2) 1 20 30 2 24 20 3 17 27 Total 61 77 Step four: Use this formula to find the Pearson correlation coefficient value. people, but the ideal sample size to calculate a Pearson correlation coefficient should be more than ten people. SPEARMAN RANK COEFFICIENT The Spearman rank correlation coefficient, rs, is the nonparametric version of the Pearson correlation coefficient. Your data must be ordinal, interval or ratio. Spearman’s returns a value from -1 to 1, where: +1 = a perfect positive correlation between ranks -1 = a perfect negative correlation between ranks 0 = no correlation between ranks. The formula for the Spearman rank correlation coefficient when there are no tied ranks is: CORRELATION chart using basic 600 480 459 400 576 289 900 400 729 Sample Question: The scores for nine students in physics and math are as follows: Physics: 35, 23, 47, 17, 10, 43, 9, 6, 28 Mathematics: 30, 33, 45, 23, 8, 49, 12, 4, 31 Compute the student’s ranks in the two subjects and compute the Spearman rank correlation. Find the ranks for each individual subject. I used the Excel rank function to find the ranks. If you want to rank by hand, order the scores from greatest to smallest; assign the rank 1 to the highest score, 2 to the next highest and so on: 600 480 459 1539 1265 2029 400 576 289 900 400 729 Pearson Correlation Coefficient Formula Step five: Once you complete the formula above by plugging in all the correct values, the result is your coefficient value! If the value is a negative number, then there is a negative correlation of relationship strength, and if the value is a positive number, then there is a positive correlation of relationship strength. Note: The above examples only show data for three @ IJTSRD | Available Online @ www.ijtsrd.com | Volume – 2 | Issue – 5 | Jul-Aug 2018 Page: 1109
International Journal of Trend in Scientific Research and Development (IJTSRD) ISSN: 2456-6470 ?Allowing for flexible responses as ambiguity becomes clearer In short, seen in this way then, correlation in business decision making processes protects us from what we don’t know. Along with probability then, they ensure that we make decisions that properly account for the risk at hand. ROLE OF CORRELATION IN DAILY LIFE WITH COMMON EXAMPLES OF POSITIVE CORRELATION ?The more time you spend running on a treadmill, the more calories you will burn. ?Taller people have larger shoe sizes and shorter people have smaller shoe sizes. ?The longer your hair grows the more shampoo you will need. ?The less time I spend marketing my business, the fewer new customers I will have. ?The more hours you spend in direct sunlight, the more severe your sunburn. ?The more money she saves, the more financially secure she feels. ?As the temperature goes up, ice cream sales also go up. ?When an employee works more hours his pay check increases proportionately. ?The more gasoline you put in your car, the farther it can go. ?The longer someone invests the more compound interest he will earn. ?The longer amount of time you spend in the bath, the more wrinkly your skin becomes. ?As it snows more, the sales for deicers go up. ?As you drink more coffee, the number of hours you stay awake increases. ?As a child grows, so does his clothing size. ?As her salary increased, so did her spending. ?The more it rains, the more sales for umbrellas go up. ?Taller people tend to weigh more and shorter people tend to weigh less. ?As a person’s level of happiness decreases, so does his level of helpfulness. ?People who suffer from depression have higher rates of suicide than those who do not. ?As more people go to the movies, the amount of money spent on tickets increases. ?When workers get a raise, morale improves. ?As tread on your car’s tires decreases, traction with the road decreases. ROLE OF CORRELATION IN BUSINESS This occurs because people frequently treat a correlation as a cause. For example here are four common business correlations: ?Doing a good job correlates with getting a pay raise. ?Hiring a good sales person correlates with seeing more sales. ?The conscientious personality type correlates with fewer process errors. ?Spending more on research correlates with more innovation. Yet, in each case, one does not automatically cause the other. Other factors come into play. Some we know. Some we don’t. So, simply, the importance of correlation in business decision making processes means better weighing of these factors. As a contrasting example, take a manufacturing process. It generally accounts for all factors. Few unknown ones exist. That’s how it can produce the same product over and over again. Little variation occurs. In other words, doing X, Y and Z to A, B and C cause a specific outcome again and again. The four examples above are quite different from a manufacturing process. There are many unknowns. Many aren’t controllable too. As a result, each example yields a range of outcomes as opposed to a single, specific one. In many ways then, a decision making process is making use of correlation, if it accounts for unknown or difficult factors that show up as uncertainty, volatility, complexity and ambiguity. These four can wreak havoc on any decision. This does not mean it has to identify the factors causing this. It just means it accounts for them. In summary then, the key importance of correlation in business decision making processes is that it protects us from uncertainty, volatility, complexity and ambiguity. It does this by compelling the process to account for these four by means such as these: ?Holding resources in reserve and taking small steps against uncertainty ?Avoiding instant decisions until volatility shows a more definite trend ?Simplifying complexity or finding those who can handle it well @ IJTSRD | Available Online @ www.ijtsrd.com | Volume – 2 | Issue – 5 | Jul-Aug 2018 Page: 1110
International Journal of Trend in Scientific Research and Development (IJTSRD) ISSN: 2456-6470 ?As the level of water lowers in a fish tank, the volume of the habitat for the fish decreases. ?The faster a jet pilot flies, the higher the G-forces are. ?The more you exercise your muscles, the stronger they get. ?When employees make a high salary, efficiency increases. ?As the wattage of light bulbs increases, the light output increases. @ IJTSRD | Available Online @ www.ijtsrd.com | Volume – 2 | Issue – 5 | Jul-Aug 2018 Page: 1111