Download
1 / 5
50 likes | 55 Views
"This paper presents the experimental study for comparison of surface roughness of work piece when grinding three types of 3X13, SKD11 and SUJ2 steels with CBN grinding wheel. The comparison methods in this study include comparison by means, comparison by numerical charts, comparison by histogram plot, and comparison by criteria's of probability theory. The results show that comparison by criteria's of probability theory leads to more reliability than other methods. On this basis, the values of surface roughness of 3X13 and SUJ2 steels are determined to be equal. Meanwhile, the surface roughness of SKD11 steel is much lower than that of the other two steel types. Nguyen Hong Son ""Comparative Experiment of Surface Roughness when Grinding 3X13, SKD11 and SUJ2 Steels with CBN Grinding Wheel"" Published in International Journal of Trend in Scientific Research and Development (ijtsrd), ISSN: 2456-6470, Volume-4 | Issue-2 , February 2020, URL: https://www.ijtsrd.com/papers/ijtsrd29986.pdf<br><br>Paper Url : https://www.ijtsrd.com/engineering/mechanical-engineering/29986/comparative-experiment-of-surface-roughness-when-grinding-3x13-skd11-and-suj2-steels-with-cbn-grinding-wheel/nguyen-hong-son"<br>

E N D
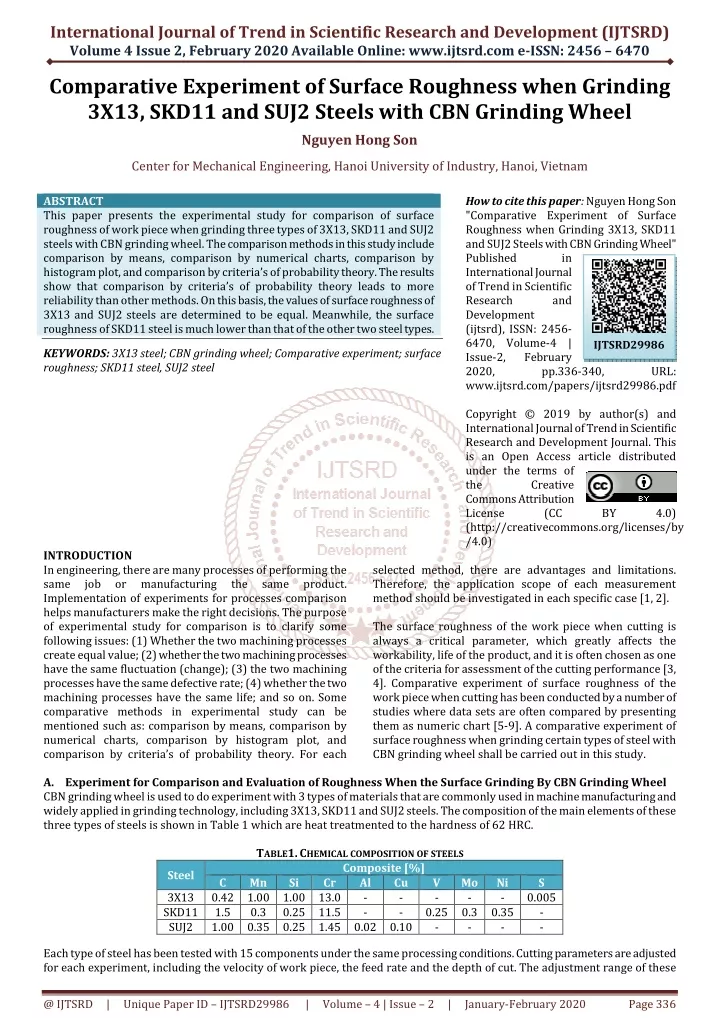
International Journal of Trend in Scientific Research and Development (IJTSRD) Volume 4 Issue 2, February 2020 Available Online: www.ijtsrd.com e-ISSN: 2456 – 6470 Comparative Experiment of Surface Roughness when Grinding 3X13, SKD11 and SUJ2 Steels with CBN Grinding Wheel Nguyen Hong Son Center for Mechanical Engineering, Hanoi University of Industry, Hanoi, Vietnam ABSTRACT This paper presents the experimental study for comparison of surface roughness of work piece when grinding three types of 3X13, SKD11 and SUJ2 steels with CBN grinding wheel. The comparison methods in this study include comparison by means, comparison by numerical charts, comparison by histogram plot, and comparison by criteria’s of probability theory. The results show that comparison by criteria’s of probability theory leads to more reliability than other methods. On this basis, the values of surface roughness of 3X13 and SUJ2 steels are determined to be equal. Meanwhile, the surface roughness of SKD11 steel is much lower than that of the other two steel types. KEYWORDS: 3X13 steel; CBN grinding wheel; Comparative experiment; surface roughness; SKD11 steel, SUJ2 steel How to cite this paper: Nguyen Hong Son "Comparative Experiment of Surface Roughness when Grinding 3X13, SKD11 and SUJ2 Steels with CBN Grinding Wheel" Published in International Journal of Trend in Scientific Research and Development (ijtsrd), ISSN: 2456- 6470, Volume-4 | Issue-2, February 2020, pp.336-340, www.ijtsrd.com/papers/ijtsrd29986.pdf Copyright © 2019 by author(s) and International Journal of Trend in Scientific Research and Development Journal. This is an Open Access article distributed under the terms of the Creative Commons Attribution License (CC (http://creativecommons.org/licenses/by /4.0) IJTSRD29986 URL: BY 4.0) INTRODUCTION In engineering, there are many processes of performing the same job or manufacturing Implementation of experiments for processes comparison helps manufacturers make the right decisions. The purpose of experimental study for comparison is to clarify some following issues: (1) Whether the two machining processes create equal value; (2) whether the two machining processes have the same fluctuation (change); (3) the two machining processes have the same defective rate; (4) whether the two machining processes have the same life; and so on. Some comparative methods in experimental study can be mentioned such as: comparison by means, comparison by numerical charts, comparison by histogram plot, and comparison by criteria’s of probability theory. For each A.Experiment for Comparison and Evaluation of Roughness When the Surface Grinding By CBN Grinding Wheel CBN grinding wheel is used to do experiment with 3 types of materials that are commonly used in machine manufacturing and widely applied in grinding technology, including 3X13, SKD11 and SUJ2 steels. The composition of the main elements of these three types of steels is shown in Table 1 which are heat treatmented to the hardness of 62 HRC. TABLE1.CHEMICAL COMPOSITION OF STEELS Composite [%] C Mn Si Cr Al 3X13 0.42 1.00 1.00 13.0 SKD11 1.5 0.3 0.25 11.5 SUJ2 1.00 0.35 0.25 1.45 0.02 0.10 Each type of steel has been tested with 15 components under the same processing conditions. Cutting parameters are adjusted for each experiment, including the velocity of work piece, the feed rate and the depth of cut. The adjustment range of these selected method, there are advantages and limitations. Therefore, the application scope of each measurement method should be investigated in each specific case [1, 2]. The surface roughness of the work piece when cutting is always a critical parameter, which greatly affects the workability, life of the product, and it is often chosen as one of the criteria for assessment of the cutting performance [3, 4]. Comparative experiment of surface roughness of the work piece when cutting has been conducted by a number of studies where data sets are often compared by presenting them as numeric chart [5-9]. A comparative experiment of surface roughness when grinding certain types of steel with CBN grinding wheel shall be carried out in this study. the same product. Steel Cu - - V - Mo - 0.3 - Ni - 0.35 - S - - 0.005 - - 0.25 - @ IJTSRD | Unique Paper ID – IJTSRD29986 | Volume – 4 | Issue – 2 | January-February 2020 Page 336
International Journal of Trend in Scientific Research and Development (IJTSRD) @ www.ijtsrd.com eISSN: 2456-6470 three parameters is 5 ÷ 15 (m/min), 3 ÷ 5 (mm/stroke) and 0.01 ÷ 0.02 (mm) respectively. Experimental results are showned in Table 2 TABLE2.EXPERIMENTAL RESULTS Experiment number 1 2 3 4 5 6 7 8 Surface roughness, Ra 3X13 0.55 0.86 0.83 0.93 0.93 0.9 0.82 0.99 1.22 1.36 1.48 1.44 1.46 1.54 SKD11 0.46 0.75 0.82 0.68 0.59 0.66 0.82 0.8 SUJ2 1.12 1.42 1.16 1.55 1.34 1.16 1.11 1.16 1.14 Mean Steel 9 10 11 12 13 14 15 1.5 1.12 0.64 1.19 0.55 0.65 0.62 0.66 0.54 0.52 0.55 1.2 1.13 1.37 0.92 0.98 1.02 According to the data in Table 2, the average values of roughness when grinding three types of 3X13, SKD11 and SUJ2 steels are 1.12 (µm), 0.64 (µm) and 1.19 (µm) respectively. However, if this average value used only to come to a conclusion about the processing roughness of each steel type is not sufficiently scientific basis. It can be said that because the meaning of a data set has not only depended on the average value but also has been evaluated through many other parameters. Another method of comparative experimentation often used is to represent figures in the form of a chart, such as a bar chart as shown in figure 1 or Histograms plot as shown in figure 2 to figure. 4. The observation of figure 1 is showed that the surface roughness when grinding SKD11 steel is clearly smaller than when grinding 3X13 and SUJ2 steels. However, Figure 1 also showed that it is very difficult to compare surface roughness when grinding 2 types of 3X13 and SUJ2 steels. It can be said that because in each experiment, the surface roughness value of 3X13 steel is sometimes smaller, approximately equal or greater than its’s SUJ2 steel. Fig1. Surface roughness of steels Observing Histogram plot in Figures 2 to 4 will permit us to determine the variation in surface roughness value for each type of steel, as well as the frequency of roughness values. From these figures it is showed that surface roughness when grinding SKD11 steel is always smaller than that when grinding 3X13 and SUJ2 steels. However, just like when looking at Figure 1, observing Figure 2 to Figure 4 is also difficult to make an accurate judgment when comparing surface roughness of SKD11 and SUJ2 steels. Fig2. Histogram plot of Surface roughness - 3X13 steel @ IJTSRD | Unique Paper ID – IJTSRD29986 | Volume – 4 | Issue – 2 | January-February 2020 Page 337
International Journal of Trend in Scientific Research and Development (IJTSRD) @ www.ijtsrd.com eISSN: 2456-6470 Fig3. Histogram plot of Surface roughness - SKD11 steel Fig4. Histogram plot of Surface roughness - SUJ2 steel On the basis of the above analysis shows, it is difficult to make an accurate comment if only the data sheet or the average of the data or frequency charts is used to compare the surface roughness of the three steel types. Therefore, it is necessary to compare many parameters of the data sets against the criterias of probability theory to compare the roughness of the three steel types as shown in Table 2. The data set parameters used for comparison include mean, standard deviations, and standard errors combined with individual value to further clarify the statements. Use the Minitab 16 statistical software to compare surface roughness when grinding three types of steel, assuming that the surface roughness when grinding three types of steel is "not equal". Results are presented in tables 3 to 5, and figures 5 to 7. TABLE3.TWO-SAMPLE T-TEST AND CI:3X13,SKD11 Two-sample T for 3X13 vs SKD11 Steel N Mean 3X13 15 1.121 SKD11 15 0.645 Difference = mu (3X13) - mu (SKD11) 95% CI for difference: (0.2907, 0.6613) T-Test of difference = 0.2 (vs not =): T-Value = 3.14 P-Value = 0.006 DF = 17 St Dev 0.321 0.114 SE Mean 0.083 0.029 Fig5. Individual value of 3X13 and SKD11 steel’s surface roughness Observations from Table 3 show that the Mean of roughness when grinding SKD11 steel is much smaller than surface roughness when grinding 3X13 steel. This can also be seen clearly when observing Figure 5. On the other hand, the standard @ IJTSRD | Unique Paper ID – IJTSRD29986 | Volume – 4 | Issue – 2 | January-February 2020 Page 338
International Journal of Trend in Scientific Research and Development (IJTSRD) @ www.ijtsrd.com eISSN: 2456-6470 deviation value and standard error of the two data sets on surface roughness also differ quite a lot. In addition, the probability coefficient P-Value = 0.006, it is much smaller than the significance level (the α significance level is often chosen as 0.05). This shows that the hypothesis that the roughness of SKD11 steel surface is "not equal" to that of 3X13 steel surface is completely accurate. We can come to the conclusion that the surface roughness of KSD11 steel will be smaller than the roughness when grinding 3X13 steel. TABLE4.TWO-SAMPLE T-TEST AND CI:SKD11,SUJ2 Two-sample T for SKD11 vs SUJ2 Steel N Mean SKD11 15 0.645 SUJ2 15 1.185 Difference = mu (SKD11) - mu (SUJ2) Estimate for difference: -0.5407 95% CI for difference: (-0.6495, -0.4319) T-Test of difference = 0.1 (vs not =): T-Value = -12.15 P-Value = 0.000 DF = 24 St Dev 0.114 0.170 SE Mean 0.029 0.044 Fig6. Individual value of SKD11 and SUJ2 steel’s surface roughness The observation of Table 4 shows that the Mean of roughness when grinding SUJ2 steel is much greater than when grinding SKD11 steel. The observation of Figure 6 also confirms this comment. On the other hand, the standard deviation values and standard error of the two data sets on surface roughness also differ quite a lot. In addition, the probability coefficient is extremely small compared to the significance level P-Value = 0.000. In this case, the hypothesis that SKD11 steel surface roughness is "not equal" to that of SUJ2 steel surface is also completely correct. We come to the conclusion that the surface roughness of SUJ2 steel is always greater than that of SKD11 steel. TABLE5.TWO-SAMPLE T-TEST AND CI:3X13,SUJ2 Two-sample T for SKD11 vs SUJ2 Steel N Mean 3X13 15 1.121 SUJ2 15 1.185 Difference = mu (3X13) - mu (SUJ2) Estimate for difference: -0.0647 95% CI for difference: (-0.2595, 0.1302) T-Test of difference = 0.1 (vs not =): T-Value = -1.76 P-Value = 0.093 DF = 21 St Dev 0.321 0.170 SE Mean 0.083 0.044 Fig7. Individual value of 3X13 and SUJ2 steel’s surface roughness From Table 5 and Figure 7, it shows that the Mean of the roughness when grinding two types of 3X13 steel and SUJ 2 steel is not significantly different. In addition, the probability value P-Value = 0.093 is greater than the significance level (α = 0.05). In this case, the hypothesis that the surface roughness when grinding 3X13 steel is "not equal" to the surface roughness when grinding SUJ2 steel did not occur (hypothesis is removed). This means that the surface roughness when grinding these two steels has equal value. @ IJTSRD | Unique Paper ID – IJTSRD29986 | Volume – 4 | Issue – 2 | January-February 2020 Page 339
International Journal of Trend in Scientific Research and Development (IJTSRD) @ www.ijtsrd.com eISSN: 2456-6470 [6]Roughness in Al-(1-2) Fe-1V-1Si Alloys,” Materials and Manufacturing Processes, No. 28, 2013, pp. 463–469. B.Conclusion Several methods of comparing surface roughness when grinding three types of steel of 3X13, SKD11 and SUJ2 with CBN grinding wheel were performed in this study. As a result, surface roughness of SKD11 steel is always smaller than surface roughness when grinding 3X13 and SUJ2 steel. The surface roughness of 3X13 and SUJ2 steel is not significantly different. References [1]Douglas C. Montgomery, “Design And Analysis Of Experiments,” John Wiln & Sons, Inc., 2012, 5th Edition. [7]Nguyen Hong Son, Do Duc Trung, “A study on surface roughness of work piece when surface grinding using CBN grinding wheel,” Journal of Multidisciplinary Engineering Science and Technology, Vol. 6, No. 11, 2019, pp. 11077-11080. [8]Zhenyu ZHAO, Yongshan XIAO, Yongqi ZHU, Bai LIU, “Influence of Cutting Speed on Cutting Force in High- speed Milling,” Advanced Materials Research, Vol. 139- 141, 2010, pp. 835-838. [2]Angela Dean and Daniel Voss, “Design and Analysis of Experiments, Springer”, 1999. [9]Hasan Gökkaya, “The Effects of Machining Parameters on Cutting Forces, Surface Roughness, Built-Up Edge (BUE) and Built-Up Layer (BUL) During Machining AA2014 (T4) Alloy,” Strojniški vestnik - Journal of Mechanical Engineering, Vol. 56, 2010, pp. 584-593. [3]Banh Tien Long, Tran The Luc, Tran Sy Tuy, “Principles of Materials Processing,” Science and Technics Publishing House, Ha Noi 2013. [10]Navneet Khanna, Kuldip S Sangwan, “Interrupted machining analysis for Ti6Al4V and Ti5553 titanium alloys using physical vapor deposition (PVD)–coated carbide inserts,” Proc IMechE Part B:J Engineering Manufacture, Vol. 227, No.3, 2013, pp.465–470. [4]Tran Van Dịch, Nguyen Trong Binh, Nguyen The Dat, Nguyen Viet Tiep, Tran Xuan Viet, “Manufacturing technology,” Science and technics publishing House, 2003. [5]B. N. Pathak, K. L. Sahoo, Madhawanand Mishra , “Effect of Machining Parameters on Cutting Forces and Surface @ IJTSRD | Unique Paper ID – IJTSRD29986 | Volume – 4 | Issue – 2 | January-February 2020 Page 340