Download
1 / 9
90 likes | 221 Views
Medicaid Coverage and Spending. Diane Rowland, Sc.D. Executive Vice President, Henry J. Kaiser Family Foundation and Executive Director, Kaiser Commission on Medicaid and the Uninsured for Alliance for Health Reform Briefing: Inside Deficit Reduction: What it Means for Medicaid

E N D
Medicaid Coverage and Spending Diane Rowland, Sc.D. Executive Vice President, Henry J. Kaiser Family Foundation and Executive Director, Kaiser Commission on Medicaid and the Uninsured for Alliance for Health Reform Briefing: Inside Deficit Reduction: What it Means for Medicaid Washington, DC November 10, 2011
Health Care Coverage and Personal Health Care Expenditures in the U.S., 2009 Health Spending Health Coverage Other Government Programs 4% Total = 300 million Total = $2.1 trillion SOURCE: Health insurance coverage: KCMU/Urban Institute analysis of 2009 ASEC Supplement to the CPS. Health expenditures: KFF calculations using NHE data from CMS, Office of the Actuary
Medicaid has many roles in our health care system. Health Insurance Coverage 29 million children & 15 million adults in low-income families; 15 million elderly and persons with disabilities Assistance to Medicare Beneficiaries 8.9 million aged and disabled — 21% of Medicare beneficiaries Long-Term Care Assistance 1 million nursing home residents; 2.8 million community-based residents MEDICAID Support for Health Care System and Safety-net 16% of national health spending; 40% of long-term care services State Capacity for Health Coverage Federal share can range from 50 - 83%; For FFY 2012, ranges from 50 - 74.2%
Most beneficiaries are children, but the elderly and disabled account for the majority of Medicaid spending. Total = 59.5 million Total = $317.7 billion NOTE: Percentages may not add up to 100 due to rounding. SOURCE:KCMU/Urban Institute estimates based on data from FY 2008 MSIS and CMS Form-64, 2010.
Disability and long-term care drive higher per-enrollee spending. $14,481 Long-Term Care $12,499 Acute Care $5,163 $2,541 $2,135 SOURCE: Kaiser Commission on Medicaid and the Uninsured and Urban Institute estimates based on 2007 MSIS and CMS64 data.
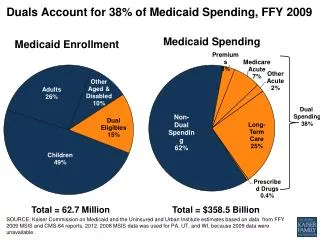
Duals Account for 39% of Medicaid Spending. Medicaid Spending Medicaid Enrollment Premiums 4% Medicare Acute 6% Adults 25% Other Acute 2% Other Aged & Disabled 10% Non-Dual Spending 60% Duals 15% Long-Term Care 27% Dual Spending 39% Children 50% Prescribed Drugs 0.4% Total = 58 Million Total = $311 Billion SOURCE: Urban Institute estimates based on FFY 2007 data from MSIS and CMS Form 64, prepared for the Kaiser Commission on Medicaid and the Uninsured, 2010.
Medicaid spending growth per enrollee has been slower than growth in private health spending. SOURCE: Urban Institute, 2010. Estimates based on data from Medicaid Financial Management Reports (HCFA/CMS Form 64), Medicaid Statistical Information System (MSIS), and KCMU/HMA enrollment data. Expenditures exclude prescription drug spending for dual eligibles to remove the effect of their transition to Medicare Part D in 2006.
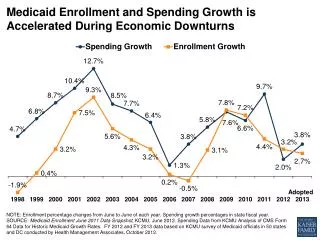
Enrollment was the largest driver of Medicaid spending during this last recession. SOURCE: Urban Institute, 2010. Estimates based on data from Medicaid Financial Management Reports (HCFA/CMS Form 64), Medicaid Statistical Information System (MSIS), and KCMU/HMA enrollment data. Expenditures exclude prescription drug spending for dual eligibles to remove the effect of their transition to Medicare Part D in 2006.
Federal share of Medicaid spending (FMAP) varies by state. Statutory Federal Medical Assistance Percentages , FY 2012 ME WA VT NH MT ND MN OR MA NY WI SD ID MI RI WY CT PA IA NJ NE OH DE IN IL NV MD CO UT WV VA CA DC KS MO KY NC TN AZ SC OK AR NM GA AL MS LA TX FL AK HI 50 percent (15 states) 51 – 59 percent (11 states) 60 – 66 percent (13 states) 67 – 74 percent (12 states including DC) NOTE: Rates are rounded to nearest percent. These rates will be in effect Oct. 1, 2011 – Sept. 30, 2012. SOURCE: Federal Register,, Nov, 10, 2010 (Vol. 75, No. 217), pp. 69082-69083. http://edocket.access.gpo.gov/2010/pdf/2010-28319.pdf