Download
1 / 24
250 likes | 815 Views
Student’s t Distribution. Lecture 45 Section 10.2 Tue, Apr 13, 2004. What if is Unknown?. It is more realistic to assume that the value of is unknown. (If we don’t know the value of , then we probably don’t know the value of ). In this case, we use s to estimate .

E N D
Student’s t Distribution Lecture 45 Section 10.2 Tue, Apr 13, 2004
What if is Unknown? • It is more realistic to assume that the value of is unknown. • (If we don’t know the value of , then we probably don’t know the value of ). • In this case, we use s to estimate .
What if is Unknown? • Let us assume that the population is normal or nearly normal. • Then the distribution ofx is normal. x is N(, /n). • The trouble is,x is not N(, s/n) unless the sample size is large enough, say n 30.
What if is Unknown? • Ifx is not N(, s/n), then (x – )/(s/n) is not N(0, 1). • If it is not N(0, 1) , then what is it? • It has a distribution called Student’s t distribution. t = (x – )/(s/n).
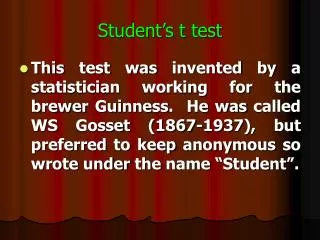
Student’s t Distribution • The t distribution was discovered by W. S. Gosset in 1908. • He used the pseudonym Student to avoid getting fired for doing statistics on the job!!!
The t Distribution • The shape of the t distribution is very similar to the shape of the standard normal distribution. • The t distribution has a (slightly) different shape for each possible sample size. • They are all symmetric and unimodal. • They are all centered at 0.
The t Distribution • They are somewhat broader than Z, reflecting the additional uncertainty resulting from using s in place of . • As n gets larger and larger, the shape of the t distribution approaches the standard normal.
Degrees of Freedom • If the sample size is n, then t is said to have n – 1 degrees of freedom. • We use df to denote degrees of freedom.
Normal vs. t Distribution • N(0, 1), t(2), and t(30).
Table IV – t Percentiles • Table IV gives certain percentiles of t for certain degrees of freedom. • Percentiles for upper-tail areas: • 0.40, 0.30, 0.20, 0.10, 0.05, 0.025, 0.01, 0.005. • Specific degrees of freedom: • 1, 2, 3, …, 30, 40, 60, 120.
Table IV – t Percentiles • The table tells us, for example, that • P(t > 1.812) = 0.05, when df = 10. • What is P(t < –1.812), when df = 10? • Since the t distribution is symmetric, we can also use the table for lower tails by making the t values negative.
The t Distribution on the TI-83 • The TI-83 will find probabilities for the t distribution (but not percentiles). • Press DISTR. • Select tcdf and press ENTER. • tcdf( appears in the display. • Enter the lower endpoint. • Enter the upper endpoint.
The t Distribution on the TI-83 • Enter the number of degrees of freedom. • Press ENTER. • The result is the probability.
Example • Enter tcdf(1.812, 99, 10). • The result is 0.0500. • Thus, P(t > 1.812) = 0.05 when there are 10 degrees of freedom (n = 11).
Hypothesis Testing with t • We should use t if • The population is normal (or nearly normal), and • is unknown, so we use s in its place, and • The sample size is small (n < 30). • Otherwise, we should not use t.
Hypothesis Testing with t • The hypothesis testing procedure is the same except for two steps. • Step 3: Find the value of the test statistic. • The test statistic is now t = (x – 0)/(s/n). • Step 4: Find the p-value. • We must look it up in the t table, or use tcdf on the TI-83.
Example • Re-do Example 10.1 under the assumption that is unknown.
Hypothesis Testing on the TI-83 When is Unknown • Press STAT. • Select TESTS. • Select T-Test. • A window appears requesting information. • Choose Data or Stats.
Hypothesis Testing on the TI-83 When is Unknown • Assuming we selected Stats, • Enter 0. • Enterx. • Enter s. (Remember, is unknown.) • Enter n. • Select the alternative hypothesis and press ENTER. • Select Calculate and press ENTER.
Hypothesis Testing on the TI-83 When is Unknown • A window appears with the following information. • The title “T-Test” • The alternative hypothesis. • The value of the test statistic t. • The p-value. • The sample mean.
Hypothesis Testing on the TI-83 When is Unknown • The sample standard deviation. • The sample size.
Example • Re-do Example 10.1 on the TI-83 under the assumption that is unknown.
Let’s Do It! • Let’s do it! 10.3, p. 582 – Study Time. • Let’s do it! 10.4, p. 583 – pH Levels.
Assignment • Page 585: Exercises 7, 8, 9*, 10*, 11*, 13*, 15*, 16*. • Page 606: Exercises 34*, 35*, 38*, 40, 41*. * Show of the steps of the hypothesis test.