Download
1 / 41
610 likes | 2.6k Views
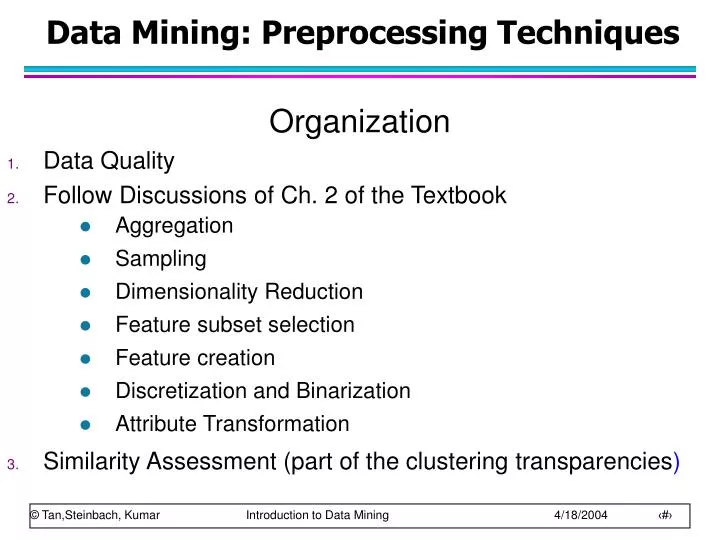
Data Mining: Preprocessing Techniques. Organization Data Quality Follow Discussions of Ch. 2 of the Textbook Aggregation Sampling Dimensionality Reduction Feature subset selection Feature creation Discretization and Binarization Attribute Transformation

E N D
Data Mining: Preprocessing Techniques Organization • Data Quality • Follow Discussions of Ch. 2 of the Textbook • Aggregation • Sampling • Dimensionality Reduction • Feature subset selection • Feature creation • Discretization and Binarization • Attribute Transformation • Similarity Assessment (part of the clustering transparencies)
Data Quality • What kinds of data quality problems? • How can we detect problems with the data? • What can we do about these problems? • Examples of data quality problems: • Noise and outliers • missing values • duplicate data
Noise • Noise refers to modification of original values • Examples: distortion of a person’s voice when talking on a poor phone and “snow” on television screen Two Sine Waves Two Sine Waves + Noise
Outliers • Outliers are data objects with characteristics that are considerably different than most of the other data objects in the data set
Missing Values • Reasons for missing values • Information is not collected (e.g., people decline to give their age and weight) • Attributes may not be applicable to all cases (e.g., annual income is not applicable to children) • Handling missing values • Eliminate Data Objects • Estimate Missing Values • Ignore the Missing Value During Analysis • Replace with all possible values (weighted by their probabilities)
Duplicate Data • Data set may include data objects that are duplicates, or almost duplicates of one another • Major issue when merging data from heterogeous sources • Examples: • Same person with multiple email addresses • Data cleaning • Process of dealing with duplicate data issues
Data Preprocessing • Aggregation • Sampling • Dimensionality Reduction • Feature subset selection • Feature creation • Discretization and Binarization • Attribute Transformation
Aggregation • Combining two or more attributes (or objects) into a single attribute (or object) • Purpose • Data reduction • Reduce the number of attributes or objects • Change of scale • Cities aggregated into regions, states, countries, etc • More “stable” data • Aggregated data tends to have less variability
Aggregation Variation of Precipitation in Australia Standard Deviation of Average Monthly Precipitation Standard Deviation of Average Yearly Precipitation
Sampling • Sampling is the main technique employed for data selection. • It is often used for both the preliminary investigation of the data and the final data analysis. • Statisticians sample because obtaining the entire set of data of interest is too expensive or time consuming. • Sampling is used in data mining because processing the entire set of data of interest is too expensive or time consuming.
Sampling … • The key principle for effective sampling is the following: • using a sample will work almost as well as using the entire data sets, if the sample is representative • A sample is representative if it has approximately the same property (of interest) as the original set of data
Types of Sampling • Sampling without replacement • As each item is selected, it is removed from the population • Sampling with replacement • Objects are not removed from the population as they are selected for the sample. • In sampling with replacement, the same object can be picked up more than once • Stratified sampling • Split the data into several partitions; then draw random samples from each partition
Sample Size 8000 points 2000 Points 500 Points
Curse of Dimensionality • When dimensionality increases, data becomes increasingly sparse in the space that it occupies • Definitions of density and distance between points, which is critical for clustering and outlier detection, become less meaningful • Randomly generate 500 points • Compute difference between max and min distance between any pair of points
Dimensionality Reduction • Purpose: • Avoid curse of dimensionality • Reduce amount of time and memory required by data mining algorithms • Allow data to be more easily visualized • May help to eliminate irrelevant features or reduce noise • Techniques • Principle Component Analysis • Singular Value Decomposition • Others: supervised and non-linear techniques
Dimensionality Reduction: PCA • Goal is to find a projection that captures the largest amount of variation in data x2 e x1
Dimensionality Reduction: PCA • Find the m eigenvectors of the covariance matrix • The eigenvectors define the new space • Select only those m eigenvectors that contribute the most to the variation in the dataset (m<n) x2 e x1
Dimensionality Reduction: ISOMAP • Construct a neighbourhood graph • For each pair of points in the graph, compute the shortest path distances – geodesic distances By: Tenenbaum, de Silva, Langford (2000)
Feature Subset Selection • Another way to reduce dimensionality of data • Redundant features • duplicate much or all of the information contained in one or more other attributes • Example: purchase price of a product and the amount of sales tax paid • Irrelevant features • contain no information that is useful for the data mining task at hand • Example: students' ID is often irrelevant to the task of predicting students' GPA
Feature Subset Selection • Techniques: • Brute-force approch: • Try all possible feature subsets as input to data mining algorithm • Embedded approaches: • Feature selection occurs naturally as part of the data mining algorithm • Filter approaches: • Features are selected before data mining algorithm is run • Wrapper approaches: • Use the data mining algorithm as a black box to find best subset of attributes
Feature Creation • Create new attributes that can capture the important information in a data set much more efficiently than the original attributes • Three general methodologies: • Feature Extraction • domain-specific • Mapping Data to New Space • Feature Construction • combining features
Mapping Data to a New Space • Fourier transform • Wavelet transform Two Sine Waves Two Sine Waves + Noise Frequency
Discretization Using Class Labels • Entropy based approach 3 categories for both x and y 5 categories for both x and y
Discretization Without Using Class Labels Data Equal interval width Equal frequency K-means
Similarity and Dissimilarity Already covered! • Similarity • Numerical measure of how alike two data objects are. • Is higher when objects are more alike. • Often falls in the range [0,1] • Dissimilarity • Numerical measure of how different are two data objects • Lower when objects are more alike • Minimum dissimilarity is often 0 • Upper limit varies • Proximity refers to a similarity or dissimilarity
Similarity/Dissimilarity for Simple Attributes p and q are the attribute values for two data objects.
Euclidean Distance • Euclidean Distance Where n is the number of dimensions (attributes) and pk and qk are, respectively, the kth attributes (components) or data objects p and q. • Standardization is necessary, if scales differ.
Euclidean Distance Distance Matrix
Minkowski Distance • Minkowski Distance is a generalization of Euclidean Distance Where r is a parameter, n is the number of dimensions (attributes) and pk and qk are, respectively, the kth attributes (components) or data objects p and q.
Minkowski Distance: Examples • r = 1. City block (Manhattan, taxicab, L1 norm) distance. • A common example of this is the Hamming distance, which is just the number of bits that are different between two binary vectors • r = 2. Euclidean distance • r. “supremum” (Lmax norm, Lnorm) distance. • This is the maximum difference between any component of the vectors • Do not confuse r with n, i.e., all these distances are defined for all numbers of dimensions.
Minkowski Distance Distance Matrix
Cover! Mahalanobis Distance is the covariance matrix of the input data X Advantage: Eliminates differences in scale and down-plays importance f correlated attributes in distance Computations. Alternative to attribute normalization! For red points, the Euclidean distance is 14.7, Mahalanobis distance is 6.
Mahalanobis Distance Covariance Matrix: C A: (0.5, 0.5) B: (0, 1) C: (1.5, 1.5) Mahal(A,B) = 5 Mahal(A,C) = 4 B A
Common Properties of a Distance • Distances, such as the Euclidean distance, have some well known properties. • d(p, q) 0 for all p and q and d(p, q) = 0 only if p= q. (Positive definiteness) • d(p, q) = d(q, p) for all p and q. (Symmetry) • d(p, r) d(p, q) + d(q, r) for all points p, q, and r. (Triangle Inequality) where d(p, q) is the distance (dissimilarity) between points (data objects), p and q. • A distance that satisfies these properties is a metric
Common Properties of a Similarity • Similarities, also have some well known properties. • s(p, q) = 1 (or maximum similarity) only if p= q. • s(p, q) = s(q, p) for all p and q. (Symmetry) where s(p, q) is the similarity between points (data objects), p and q.
Similarity Between Binary Vectors • Common situation is that objects, p and q, have only binary attributes • Compute similarities using the following quantities M01= the number of attributes where p was 0 and q was 1 M10 = the number of attributes where p was 1 and q was 0 M00= the number of attributes where p was 0 and q was 0 M11= the number of attributes where p was 1 and q was 1 • Simple Matching and Jaccard Coefficients SMC = number of matches / number of attributes = (M11 + M00) / (M01 + M10 + M11 + M00) J = number of 11 matches / number of not-both-zero attributes values = (M11) / (M01 + M10 + M11)
SMC versus Jaccard: Example p = 1 0 0 0 0 0 0 0 0 0 q = 0 0 0 0 0 0 1 0 0 1 M01= 2 (the number of attributes where p was 0 and q was 1) M10= 1 (the number of attributes where p was 1 and q was 0) M00= 7 (the number of attributes where p was 0 and q was 0) M11= 0 (the number of attributes where p was 1 and q was 1) SMC = (M11 + M00)/(M01 + M10 + M11 + M00) = (0+7) / (2+1+0+7) = 0.7 J = (M11) / (M01 + M10 + M11) = 0 / (2 + 1 + 0) = 0
Cosine Similarity • If d1 and d2 are two document vectors, then cos( d1, d2 ) = (d1d2) / ||d1|| ||d2|| , where indicates vector dot product and || d || is the length of vector d. • Example: d1= 3 2 0 5 0 0 0 2 0 0 d2 = 1 0 0 0 0 0 0 1 0 2 d1d2= 3*1 + 2*0 + 0*0 + 5*0 + 0*0 + 0*0 + 0*0 + 2*1 + 0*0 + 0*2 = 5 ||d1|| = (3*3+2*2+0*0+5*5+0*0+0*0+0*0+2*2+0*0+0*0)0.5 = (42) 0.5 = 6.481 ||d2|| = (1*1+0*0+0*0+0*0+0*0+0*0+0*0+1*1+0*0+2*2)0.5= (6) 0.5 = 2.245 cos( d1, d2 ) = .3150
Extended Jaccard Coefficient (Tanimoto) • Variation of Jaccard for continuous or count attributes • Reduces to Jaccard for binary attributes
Correlation • Correlation measures the linear relationship between objects • To compute correlation, we standardize data objects, p and q, and then take their dot product
Visually Evaluating Correlation Scatter plots showing the similarity from –1 to 1.