Download
1 / 35
680 likes | 1.92k Views
Measuring Safety Performance With Leading Indicators. John Leyland BA, DOHS, DipAdEd, CUSA, CRSP CSSE Burlington Oct 1, 2009. Presentation. Business case Examples you can use Generate some discussion Why this is important. Financial Business Case. Leading indicators measure effort to:.

E N D
Measuring Safety Performance With Leading Indicators John Leyland BA, DOHS, DipAdEd, CUSA, CRSP CSSE Burlington Oct 1, 2009
Presentation • Business case • Examples you can use • Generate some discussion • Why this is important
Financial Business Case Leading indicators measure effort to: Increase Profit Reduce Risk Reduce Injury Reduce Cost
Financial Business Case Cost in dollars • Direct costs $10,000 • Indirect costs $40,000 • Total costs $50,000 Cost in Lost Opportunity • Sales to offset costs $625,000 (cost ÷ profit margin (8%) = gross sales required to offset costs) http://www.wsib.on.ca/wsib/wsibsite.nsf/Public/BusinessResultsHealthSafety Reporting costs doesn’t change the future Managing safety performance does
Due Diligence Business Case Managing safety performance shows that • Company actively manages safety through: • Leadership • Program assessment and improvement • Training • Safety management system is working through: • External / internal auditing • There is an active internal responsibility system
Performance Business Case All well managed programs: • Set expectations for performance • Establish goals to achieve performance • Measure performance • Evaluate results • Assess ongoing needs • Build new goals to continually improvement Safety performance indicators accomplish the above
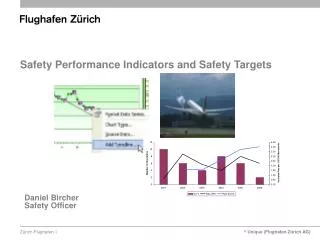
Leading Indicator Principles • Measure against standards - program / procedure • Objective measurement verifiable by auditors • Surveys backed up by external audit • Corporate plan includes safety performance goals • Performance Reported to: • Management, JHSC and staff • Board of Directors • Part of performance pay • Safety Management System nits it all together
Checks and Balances • External audits • Interviews reinforce internal performance data • Document review corroborate evidence • Internal audits • JHSC • Labour / management team • Transparency of performance activities e.g. inspections
Building Blocks for Excellence • Active Commitment from • Board of Directors • CEO / executives • All levels of management and workers • Union • Build capacity for continuous improvement • H&S resources • Safety management system • Team approach • Celebrate performance achievements • Measuring what matters most
Measure What Matters Most What matters most ? • Preventing injuries by reducing risks What should we measure ? • Risk reduction activities Leading indicators - Safety performance
Advantages of Team Approach • Teams include people beyond JHSC • Developmental opportunity for team members • Assessment & Auditing skills • Develop policy / procedure • Planning skills • Communication and presentation skills • Team building skills • Breaks down workplace barriers • Builds sense of community within volunteers • Builds commitment to safety and pride of place • Strengthens IRS (internal responsibility system)
Safety Management System • Policy - commitment • Act on commitment with safety performance goals • Safety performance in strategic plan • Identify and rank risks • Programs, procedures & forms to manage risk • Training to develop knowledge, skill and ability • Clear communications • Evaluation of performance • Report outcomes & re-evaluate needs • Celebrate success • Reset goals
Formalized SMS 18001 / CSA Z1000 • Plan, Do, Check and Act • Integrated system pulling together variety of impacts on safety and health • Overlays policies, procedures and forms onto leading indicator strategy • Reinforces measuring safety performance.
Building Performance Excellence • Benchmark your starting point • Determine performance to be measured • Establish time frame for measurement • Measure progress • Broad based benchmarks • Safety management system audit • Safety culture • Legal Compliance • Establish a plan based on needs • Active leadership • Team based programs
SMS Audit as Safety Performance • Benchmark safety management system (SMS) • Improvement plan based on results • Benchmark key audit elements • Incident investigation • Department meetings • Inspections / work observations • Established key policies and procedures for above • Involved JHSC and management in policy development – co-operative approach • Measured safety performance on programs
Audit Progression Highlights1995 – 1998 Basic programs and performance measures established • Department meetings • Workplace inspections • Incident reporting • Causes provided • Recommendations made • Actions taken • Benchmarks established • Training provided • Performance reports provided
Audit Progression Highlights1998 – 2001 Team Approach Added Team Approach • Multi departmental • Union - management • Worked on program; forms; policy; training • Wellness team • Job planning team • Equipment team
Audit Progression Highlights2001 – 2004 Move to New Plateau • Internal Audit Team • Leading indicators on corporate agenda • Part of performance pay • Celebrating success of teams and performance • Culture being developed
Safety Performance Scoring Balanced Safety Performance Scoring System • Active Leadership 20% • Performance Expectations 30% • Training & Application of Skills 20% • Program Improvement 20% • Lagging Indicators 10% Total Score 100% Build into performance pay (from E&USA)
Active Leadership Inspections Expectation 4 Executives 16 6 Directors 24 Department Safety Meetings Expectation 4 Executives 16 6 Directors 35 Total expected 91 % Score based on actual / expected e.g. 89/91 = 98% with weighting of 10% for overall score= 9.8%
Performance Expectations Work observations by management staff • Entered into software • Reported by supervisor, manager and department Departmental safety meetings (manager responsibility) Incident investigations • Causes and Recommendations provided • Follow-up corrections made Inspection and safety meeting follow-up actions • % completed vs. expected (from software reports) Wellness activities • staff involved in activities; health fair participation
Incident Includes • lost time, • medical aid, • first aid, • motor vehicle, • property damage, • near miss • contractors
Scoring Example for 10 Incidents Opportunity to provide and complete: 10 causes (+) + 10 recommendations to improve (+) + 10 follow-up actions completed (+) = 30 information items expected If there are 25 information items – Score 25/30 = 83% Weighting of 10% = 8.3%
Program Improvement • External Audit • Internal Audit • Wellness survey • Safety culture / climate survey • Policy / procedure developed • Approved & signed • Implementation plans with specific goals • Approved & signed
Score Program Improvements Done vs. Not Done = % score • Audits / Assessments completed on time • Policy and procedure completed and signed % improvement score • Pitfall – changes in audit criteria, scoring system & auditor are out of your control Audit implementation plan • % of specific items completed as per approved plan
Training and Application of Skills • Training assessment (score done vs. not done) • Evaluate impact of training (% of target) • KSA’s used on the job? • e.g. appropriate eye safety understood after training • (compliance needs management of work) Specific training needs (target % completed) • Driver training • PPE • Ergonomic
Lagging Indicators Frequency Rate • # LT × 200,000 ÷ hours worked = frequency rate Severity Rate • # days lost × 200,000 ÷ hours worked = severity rate Vehicle Incident Rate • # of MV incidents × 1,000,000 ÷ km driven = MV rate
Safety Performance Scoring Balanced Safety Performance Scoring System Actual Possible • Active Leadership 18 20% • Performance Expectations 30 30% • Training & Application of Skill 17 20% • Program Improvement 18 20% • Lagging Indicators 5 10% 88% 100% Single balanced safety performance score = 88%
Value of Leading Indicators • A number of successes built into score • Audit team results • Training team activities • Special project teams • Wellness team • Celebrate team efforts – build pride into safety • Builds culture around safety improvement • Team members build skills and knowledge • Recognition for safety performance & improvement • Build community of staff involved in safety • Track performance over time - valuable lessons • Lower emphasis on zero injuries
Sustaining Performance • Emphasis on tangible performance measures • Celebrating team and organizational performance • Build on successes • Build a healthy workplace • Sustain efforts over long term • Historical improvement shows return on investment in safety • Recognition for teams and individual members Real rewards for real safety advances
Why Do this ? Deaths in Ontario (average 308 / year)
Safety Performance Excellence • Adequate resources • Measure safety performance with leading indicators • Active & visible commitment of management • Team approach to building safety • Multi-departmental • Union / worker involvement • Celebrate success of teams • Grass root leaders
Contact Information jleyland@cogeco.ca