Download
1 / 1
10 likes | 88 Views
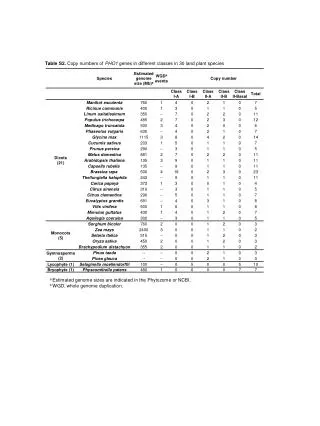
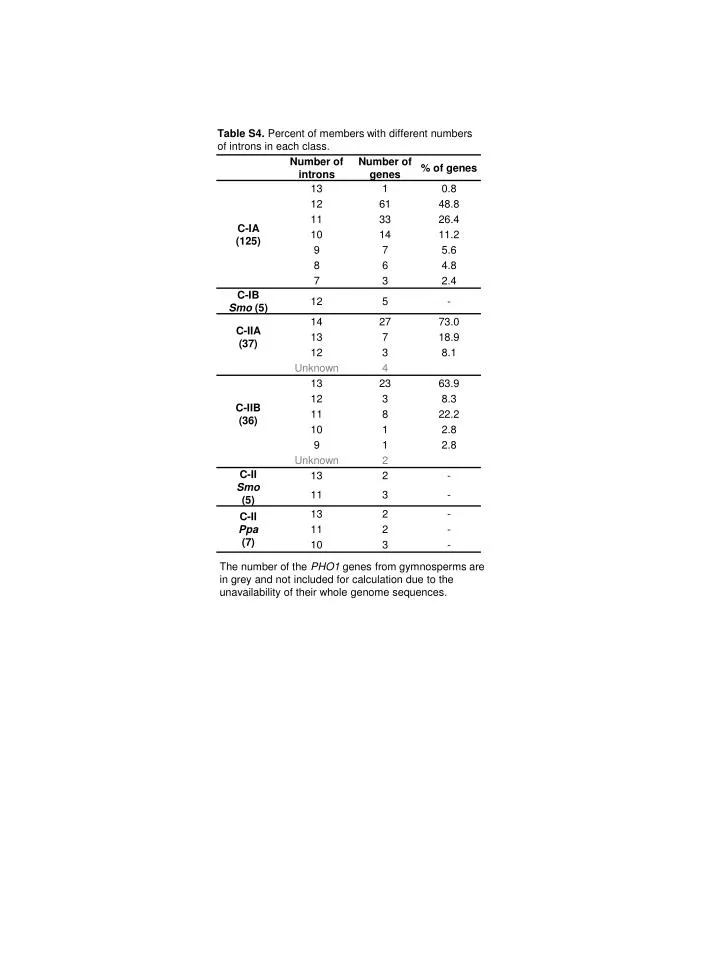
Table S4. Percent of members with different numbers of introns in each class. The number of the PHO1 genes from gymnosperms are in grey and not included for calculation due to the unavailability of their whole genome sequences.

E N D
Table S4. Percent of members with different numbers of introns in each class. The number of the PHO1 genes from gymnosperms are in grey and not included for calculation due to the unavailability of their whole genome sequences.