Download
1 / 1
10 likes | 116 Views
A. ZVAD -. ZVAD +. 0 6 12 0 6 12 hr. FL CL. Caspase-8. FL CL. Caspase-9. FL CL. Caspase-3. FL CL. PARP. α-Tubulin. B. C. control. control. ZVAD 25 μM. ZVAD 50 μM. ZVAD 50 μM. 120. 100. 90. 100. 80. 70. 80. % Control. % Positive Cells. 60. 60. 50. 40. 40.

E N D
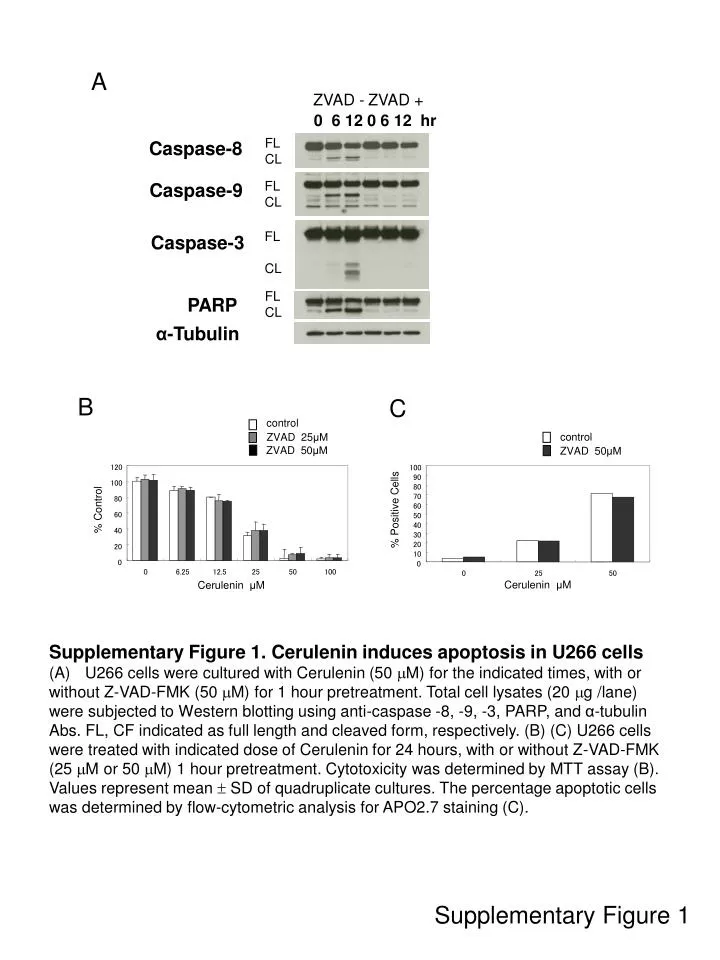
A ZVAD - ZVAD + 0 6 12 0 6 12 hr FL CL Caspase-8 FL CL Caspase-9 FL CL Caspase-3 FL CL PARP α-Tubulin B C control control ZVAD 25μM ZVAD 50μM ZVAD 50μM 120 100 90 100 80 70 80 % Control % Positive Cells 60 60 50 40 40 30 20 20 10 0 0 0 6.25 12.5 25 50 100 0 25 50 Cerulenin μM Cerulenin μM • Supplementary Figure 1. Cerulenin induces apoptosis in U266 cells • U266 cells were cultured with Cerulenin (50 M) for the indicated times, with or • without Z-VAD-FMK (50 M) for 1 hour pretreatment. Total cell lysates (20 g /lane) • were subjected to Western blotting using anti-caspase -8, -9, -3, PARP, and α-tubulin • Abs. FL, CF indicated as full length and cleaved form, respectively. (B) (C) U266 cells • were treated with indicated dose of Cerulenin for 24 hours, with or without Z-VAD-FMK • (25 M or 50 M) 1 hour pretreatment. Cytotoxicity was determined by MTT assay (B). • Values represent mean SD of quadruplicate cultures. The percentage apoptotic cells • was determined by flow-cytometric analysis for APO2.7 staining (C). Supplementary Figure 1