Download
1 / 11
110 likes | 208 Views
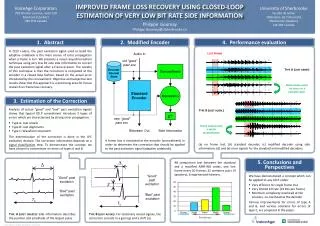
Analysis of the phase shift error between A and B signals in BPMs. BPM project. The phase shift problem. A phase shift between A and B signals may arise do to different time propagation delays of A and B in the front-end electronics. The propagation time in cables is ~1ns/ft.

E N D
Analysis of the phase shift error between A and B signals in BPMs BPM project Gustavo Cancelo
The phase shift problem • A phase shift between A and B signals may arise do to different time propagation delays of A and B in the front-end electronics. • The propagation time in cables is ~1ns/ft. • A to B cable length mismatch of 1.5cm generates a phase shift of 1 degree. • A and B signals are individually processed by analog filters. Different relative phases in the analog filters will generate an A to B phase shift. Gustavo Cancelo
A to B signal shift simulation • The phase of B is advanced with respect to the phase of A in steps of 2.57º (degrees) in the interval [0º,36º]. • The simulation computes the error in position calculation as a function of the phase shift. Gustavo Cancelo
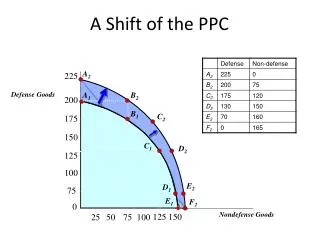
1 A waveform 15 B waveforms A and shifted B plots at high sampling frequency 36º of total phase shift in 2.57º increments Gustavo Cancelo
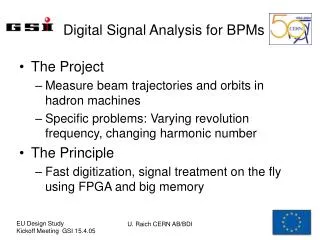
1 A waveform 15 B waveforms Plots of A and shifted B, sampled at 74MHz Samples 36º of total phase shift in 2.57º increments Gustavo Cancelo
Spectrum analysis Spectrum of A after down conversion Gustavo Cancelo
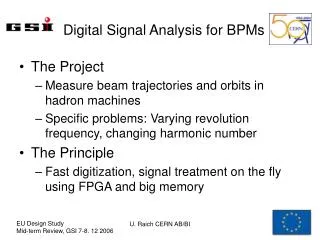
Spectrum analysis This plot shows the spectrum of A, and B shifted by 36º. The frequency range has been zoomed to 300KHz. (300KHz is the bandwidth of the “envelope filter”) The red dots represent the B magnitude and the green dots the A magnitude. Gustavo Cancelo
This plot shows the spectrum of A and B shifted by 36º. The frequency range has been around DC. The red dot represent the DC component of B and the green dots represent the DC component of A. Spectrum analysis ~ 0.2% Gustavo Cancelo
Model of the shift problem Signal model: Fourier transforms: Ringing filter model for time and frequency domains: Signal at the output of the ringing filter (frequency domain) where where The shift shows as phase information Gustavo Cancelo
Model of the shift problem Let’s assume that the signal is filtered using an ideal filter with a cutoff freq. = ω0 (e.g. ω0=2*π*300KHz) and unit gain. Gustavo Cancelo