Download
1 / 19
190 likes | 307 Views
Steelhead Genetic Diversity at Multiple Spatial Scales in the Snake River Basin, Idaho. Authors : Jennifer L. Nielsen 1 , Alan Byrne 2 , Sara L. Graziano 1 and Christine C. Kozfkay 3 1 U.S. Geological Survey, Anchorage, Alaska 99503 2 Idaho Department of Fish and Game, Boise, ID 83707

E N D
Steelhead Genetic Diversity at Multiple Spatial Scales in the Snake River Basin, Idaho Authors: Jennifer L. Nielsen1, Alan Byrne2, Sara L. Graziano1 and Christine C. Kozfkay3 1 U.S. Geological Survey, Anchorage, Alaska 99503 2 Idaho Department of Fish and Game, Boise, ID 83707 3 Idaho Department of Fish and Game, Eagle, ID 83616
Objectives • Describe the genetic diversity in Idaho’s five hatchery and 74 wild O. mykiss populations at the drainage, watershed, and population spatial scales. • Compare the genetic diversity among and between hatchery stocks and wild populations. • Investigate the genetic structure within watersheds managed with hatchery releases and those managed for wild fish. • Investigate genetic relationships between steelhead classified A- or B-run.
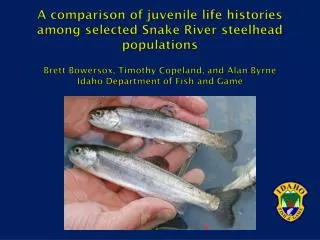
Methods • Juveniles sampled, exclude Age-0 fry • 68 anadromous accessible streams, 6 streams blocked to anadromous O. mykiss, and5 hatchery stocks. • DNA was extracted from 3,982 fin clips. • Eleven microsatellite loci were used to assess the genetic variation
Spatial scales considered Steelhead populations were grouped using the hierarchical stream structure within Idaho. • 3 Drainages: Clearwater, Salmon, Snake. • 11 Watersheds: sub-basins within each drainage. • 79 Populations: 74 tributaries within the watersheds and 5 hatchery stocks.
Analysis done at 3 different spatial scales • Basic descriptive statistics, pairwise FSTcomparisons, Garza and Williamson’s M and Ne done at drainage, watershed, and population spatial scales. • NJ trees were generated to graphically depict genetic relationships and population structure at the watershed and population scale. • AMOVA analyses were conducted at the drainage and watershed scales. • Isolation by Distance (IBD) was assessed for all 74 wild populations, the populations in the three drainages, and the watersheds.
Population pairwise FST comparisons • Oxbow, Pahsimeroi, Sawtooth hatchery stocks were not different. All pairwise FST comparisons among hatchery and wild populations that were not significantly different included these hatchery stocks and populations from the Main Salmon, Lower Snake or Little Salmon watersheds. • Dworshak and EF Salmon hatchery stocks were different from all other hatchery and wild populations. • All populations in wild managed watersheds were different from all hatchery stocks. • Results support genetically distinct steelhead populations at this spatial scale.
Pairwise FSTcomparisons at drainage and watershed spatial scales • All drainage level comparisons among the Clearwater, Salmon , and Snake were significantly different. • All watershed level comparisons were significantly different. • The Lochsa, Selway, MF Salmon, and SF Salmon had the largest pairwise FST values in comparisons with other watersheds.
Watershed pairwise Fstcomparisons including hatchery stocks • Pahsimeroi, Sawtooth, and Oxbow hatcheries were indistinguishable and were analyzed as a single group (Hatchery Group). • Dworshak, EF Salmon B, and the Hatchery Group were significantly different. • All watersheds were significantly different from the hatchery stocks. • Wild watersheds had larger pairwise FST values in comparisons with hatchery stocks than watersheds managed with hatchery releases.
Population bottlenecks using Garza’s M • None were detected at the drainage or watershed scale (all had M > 0.73). • Bottlenecks found at the population scale (M < 0.68). • In watersheds managed with hatchery releases the percent of populations with M < 0.68 ranged from 0% (Lower Snake) to 50% (Lower Clearwater). • In wild watersheds the percent of populations with M < 0.68 ranged from 77% (Lochsa) to 100% (MF Salmon)
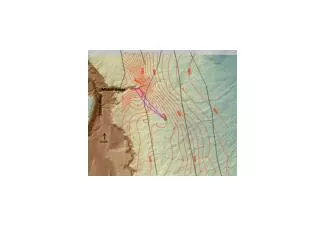
Isolation by Distance (IBD)all Snake River basin wild populations
Drainage and watershed scale IBD • Significant IBD in the Clearwater, Salmon, and Snake River drainages. • At watershed scale results were mixed • Main Salmon, SF Salmon, Little Salmon, Selway, Lower Clearwater were not significant • MF Salmon, and Lochsa were significant • Other watersheds not analyzed due to small sample size
What about A-run and B-run steelhead? • Significant difference in pairwise FST of all A- and B-run populations (FST = 0.015, p < 0.001). • All watersheds were different based on FST • AMOVA partitioned 1.33% of variance between life history types with the rest to within populations. • A and B-run watersheds and populations do not form cohesive groups in NJ trees, rather they associate with their respective drainage or watershed. • Findings suggest that genetic diversity is distributed geographically more so than by this life history designation.
Concluding remarks • Genetic structure exists at multiple spatial scales however, results were not always congruent. • Garza’a M, FST comparisons among hatchery and wild populations • Introgression by hatchery stocks seems confined to some populations in the Little Salmon, Main Salmon, and Lower Snake watersheds. • Watersheds managed for wild fish had the most distinct genetic structure and differentiation at each spatial scale we analyzed and seem unaffected by hatchery releases. • Unique genetic diversity exists at each spatial scale we analyzed and conservation of this diversity should be a high priority of management.