Download
1 / 31
310 likes | 385 Views
Magmatic fluxes. 508_2k13_lec17. Fluxes. Rates of magmatism (vol/time or similar) to be compared to rates of other tectonics processes; Can be applied to rates of everything geologic. Isotope -time relationships, but how relevant are the samples outlined in red?. Techniques.

E N D
Magmatic fluxes 508_2k13_lec17
Fluxes • Rates of magmatism (vol/time or similar) to be compared to rates of other tectonics processes; • Can be applied to rates of everything geologic.
Isotope -time relationships, but how relevant are the samples outlined in red?
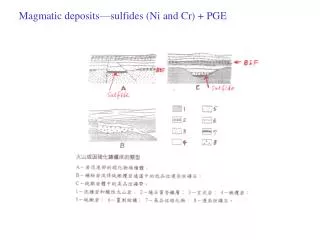
Techniques • 1. Magmatic thickening rate (MTR)= Thickness/ time (km/My) - magmatic addition in a vertical view; • 2. Apparent igneous flux (AIF) - km2/time, where the area is in plan view; • Magmatic addition rate (km3/kmMy) (MAR), volume of intrusive material per time per km leght of feature (ridge, arc, etc).
MTR • Applies to areas that contain volcanics or sill-like geometries; • Can be “translated” into the other flux parameters by assuming a certain width of the arc;
From MTR to MAR • Assume an arc width , e.g. 100 km • 0.3 x 1 km x 100 km = 30 km3/km My = 1 AU
AIFs • Conservative calculations for areas in which depth info is limited; • Rely on surface areas of plutonic/volcanic rocks and their ages; • AIR and MAR are not the same even though they both have the same units, area per time.
30 km 38 km x 150 km = 5700 km2 if thickness ~ 25 km- 143,000 km3
MAR • The most desirable way of calculating fluxes, but requires good knowledge of the 3D geology, especially if done in small time increments (1-5 Ma); • 30 km3/km My is informally known as an AU (Armstrong Unit).
MORB MAR • Pacific - 10 cm/yr 10 km/My, 1km x 6km x 10 km = 60 km3/km My; 2 AU • Atlantic 1 cm/yr = 0.6 km3/km My; • Average around 1 AU for oceans;
Arcs • Island arcs are built at 1 AU at the large scale - e.g. the entire Aleutian chair; • Steady state? If yes, it points to magmatic-dominated processes, if not, tectonic processes are influential.
Complicating the issue… • What is the area is not linear? E.g. the Arabian Nubian shield, the Mongolian terrane collage; • Choose reasonable arc widths and divide it into X arc wide area;
Depth constraints • Depth of emplacement; depth bias?
Volcano-plutonic ratios? • Anywhere between 1/4 to 1/20; • Use 1/10 if you have no info and quote me on that; • There is also a 1/1 plutonic evolved to plutonic residual ratio (actually anywhere between 2 to 1/3), so make it 1/1;
Magmatic flare-ups • Short, high flux events separated by lulls • Baseline fluxes coincide with steady state island arcs (10-30 km3/km Ma). Flare-ups generate 10 times more magma within short (5-15 My) periods. Most of the continental arcs are made in flare-ups.
HW9 • Calculate the average addition rate (km3/km My) of the BC arc between 52 and 54 lat N, knowing the arc was active for 150 My, and has an average width of 160 km and thickness of 25 km (see Figure X below); • Compare that to the average calculated by Gehrels et al., 2009 in the table Y below (or the pdf of his GSAB paper available on the class page).