Download
1 / 13
130 likes | 329 Views
Probing the Kinesin Reaction Cycle with a 2D Optical Force Clamp Block S., Asbury C., Shaevitz J,, Lang M. Reviewed by Sahar and Pablo 20.309. Release of ADP & phosphate. ATP binding. ATP Hydrolysis. Microtubule detachment. Microtubule attachment. Kinesin Movement and Reaction Cycle.

E N D
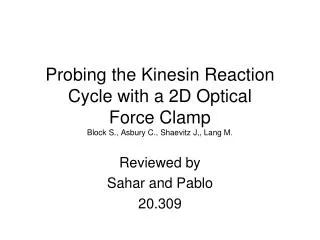
Probing the Kinesin Reaction Cycle with a 2D OpticalForce ClampBlock S., Asbury C., Shaevitz J,, Lang M. Reviewed by Sahar and Pablo 20.309
Release of ADP & phosphate ATP binding ATP Hydrolysis Microtubule detachment Microtubule attachment Kinesin Movement and Reaction Cycle Silica bead Taken from http://www.uic.edu/classes/bios/bios100/summer2006/kinesin.jpg
Objectives • Study dependence of kinesin motility on magnitude and orientation of load at various ATP concentrations, by using 2D optical force clamp • Calculate velocity, randomness, run length of kinesin • Compute turnover rate (kcat), apparent binding constant for substrate (kb), Michaelis constant (Km) • Determine number of transitions on kinesin biochemical cycle using fluctuation analysis
Results – Longitudinal Load • Forward loads had no major effects on kinesin velocity • No effect at high [ATP] • Sharp decrease in velocity with backward loads • [ATP]-dependent F1/2 • Increasing Km with increasing load • Load-dependent kcat, kb
Results – Longitudinal Load • Randomness parameter (r) • Measure for variability of kinesin motion • r -1 ~ number of rate-determining events in the system • Systems consisting of Poisson-distributed events • ATP binding limits system at low [ATP] • r~1/3 at high [ATP] • At least 4 rate-limiting steps in the system
Conclusions • Sideways loads have weak, asymmetrical effects on kinesin velocity • Longitudinal loads display sigmoidalkinesin velocity variations • Forward loads do not yield major increase in kinesin velocity • Backward loads lead to [ATP]-dependent stall • Fluctuation analysis shows that the biochemical cycle contains at least four transitions • A well-aligned one-stroke mechanism to model the relatively strong effects longitudinal load and the weak effects of the sideways loads • Weaker force dependencies account for the observed effects of sideways loads
Method of Testing Hypothesis • Studied the dependence of kinesin motility on the magnitude and direction of load at various ATP concentrations, by using a recently developed 2D optical force clamp • This instrument can record long records of the motion of individual kinesin molecules under fixed forces applied in any azimuthal direction • If motion and force production occur during a single transition in the kinesin cycle, then applied load will affect the kinetics in predictable ways. • Measuring how kcat and kb vary with force therefore provides a means to test the one-stroke model and can supply information about where other force-dependent transitions may reside in the overall reaction pathway • kcat: turnover rate, kb: apparent binding constant for substrate, ki: underlying microscopic rate constants
Calculation of Velocity & Parameters • [x(t), y(t)] = measured displacement perpendicular to and along the microtubule axis • [x(t), y(t)] = [mt + b] {+ A exp(-(-t-t0)/t }} • v = individual run velocity: from slope of line fit of x- and y- displacement vs. time • Rate parameters (kcat and kb) obtained from fit of data to MM equation v = 8.2 nm kcat[ATP] / ([ATP] + kcat/ kb) • Michaelis constant KM = kb / kcat
Calculation of Randomness and KM • variance vsdt = [y(t+dt) – (y(t) + <v>dt)]2 ~ dt • variance is linearly dependent on dt between 3.5 ms and 20 nm /<v> • r = slope of variance / d<v> , where d = 8.2 nm step size • r is equivalent to 2 D / d<v> , where D is effective diffusion coefficient in hopping model, corresponding to Markov transitions among enzyme states • Global mean randomness and standard error obtained arithmetically from r values • Mean run length : L = L + R(1-f)/f , L is average run length, f is fraction of runs that terminated inside the limited detector region, R = 300 nm • vhigh = velocity at high ATP, vlow = velocity at low ATP • Michaelis constant KM
Derived from global fit of reaction scheme to data of two sets of graphs Five State Model