Download

1 / 20
200 likes | 292 Views
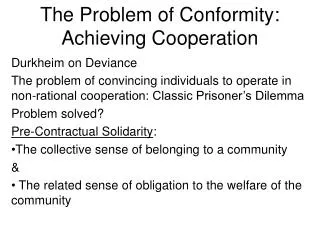
Models for Achieving Cooperation Among the Agents in Complex Systems. Dr. Chartchai Leenawong Department of Mathematics and Computer Science Faculty of Science. 0 1. 0 1. 0 1. 0. 1. 1. Team Replacement Problem. 0 p( x =. …. ) 1. …. N. 1. 2. Positions.

E N D
Models for Achieving Cooperation Among the Agents in Complex Systems Dr. Chartchai Leenawong Department of Mathematics and Computer Science Faculty of Science
0 1 0 1 0 1 0 1 1 Team Replacement Problem 0 p(x = … ) 1 … N 1 2 Positions • Only two candidates for each job position (0 or 1). • p(x) is the performance of Team x. • Objective: To choose, for each position, a candidate (0 or 1) so that the resulting team x has the best performance. Question: How is the team performance determined?
… ... ) / N p(x) = ( + + + Determining the Team Performance • The NK Model x = ... N 1 2 p1(x) p2(x) pN(x) • A positive integer Nrepresents the team size. • The contribution of the person in position i, pi(x), depends on that person and on K (0 K N 1)other people on the team, say, the K people to the right of position i, wrapping around when necessary. • pi(x)~ U[0,1].
2K+1 Combinations = (0.1 + 0.6 + 0.5)/3 = 0.4. Determining the Team Performance (Cont’d) Example N = 3, K = 1, and
The NK Problem NK Problem:Given integers N > 0 and 0 KN – 1, and given polynomial computable functions p1, …, pN, find a team (binary n-vector) x so as to Theorem:The NK problem is NP-hard. • For large N and K, it’s unlikely to find the global maximum. • A heuristic is needed to find a local maximum.
The One-Replacement Process 2N teams x 1 110(0.9) 100 (0.4) 111 (0.5) 101 (0.1) x 2 (0.2) 000 010 (0.3) 001 (0.5) 011 (0.6) x 3
0.80 0.70 N =100 Expected Performance 0.60 0.50 0 20 40 60 80 100 K The Interaction Catastrophe • How does the amount of interaction, K, affect • the team performance?
Z x = … x1 x2 xN Team Replacement Problem With a Leader pi(x,z) = Contribution to Team Performance of Worker xi with Leader z p(x, z) = Performance of Team x with Leader z E(p(x*,z)) = Expected Performance of a Local Maximum Team x* Question: How does a leader affect pi(x,z)?
Roles of Team Leaders • 1. Traditional Management Activities • - Planning • - Decision Making • - Controlling • 2. Human Resource Management Activities • - Motivating • - Disciplining/Punishing • - Seeking Cooperation • - Staffing • - Training/Developing • 3. Communication Activities • - Exchanging Information • - Handling Paperwork • 4. Networking Activities • - Interacting with Outsiders • - Socializing/Politicking
Cooperational Leadership Models Model 1: A Model Based on the Leader’s Role in Eliciting Higher Performance Contributions (The NK (,) Model) • 0 represents the cooperational skill level of the leader • is a number that represents the variation of the skill level pi(xiK,z) = F(y) where y ~ N(,) or pi(xiK,z) ~ SN(,) y ~ N(2,1) pi(xiK,z)=F(y) y
Results of Model 1 • The skill level of the leader improves the team performance • The skill of the leader can be more important than • the amount of interaction between the workers. • A more skillful leader can manage more interaction • without adversely affecting team performance, thus, • attenuating the interaction catastrophe.
Results of Model 1 (Cont’d) • For a fixed skill level of the Leader, team performance approaches 0.8 as variation approaches infinity.
Z bN b1 b2 rN r1 r2 x = … x1 x2 xN ... a1 a2 aN Model 2: A Model Based on the Leader’s Role of Achieving a Good Relationship Among the Workers (The NKLC (,) Model) [ai(xi), bi(xi)] = Contribution Range of Worker xi = [min(u1, u2), max(u1, u2)], u1 and u2 ~ U[0,1] 0 ri(xiK,z) 1 = Relationship Achieved by Leader z Between Worker xi and K Others That Interact with xi. ~ SN (,) Note: The closer ri is to 1, the more cooperation Leader z achieves. pi(xiK,z) = (1- ri(xiK,z)) ai(xi) + ri(xiK,z) bi(xi)
Model 1 V.S. Model 2 • The pattern of the curves are similar, thus leading to similar conclusions. • As the skill increases, team performance in Model 2 approaches • 0.8, rather than 1.0 as in Model 1, because the largest possible • contribution of Worker xi in Model 2 is bi(xi) 1. • [ai(xi), bi(xi)] makes Model 2 more realistic by allowing different • Workers to have different ranges of contributions
Model 1 V.S. Model 2 (Cont’d) • The variation of the skill leader affects the team performance • in both models similarly. • The curves are shifted down in Model 2 because of the • contribution range effects.
Model 3: A Model Based on the Leader’s Ability to Influence Worst-Case and Best-Case Contributions • What happens to the contribution of a worker when K is increased by 1? In the NK Model: i,pi(xiK) ~ U[0,1] and pi(xiK +1) ~ U[0,1] Ex. Team x = For position 1, when K =1, p1(x11) = 0.1 For position 1, when K =2, p1(x12) = 0.9 Far from 0.1 • A more realistic scenario: pi(xiK +1) should be within • some lower bound li and upper bound uiaround • the value of pi(xiK ), where the bounds depend on the • skill of the leader.
and uiK +1 and uiK +1 1 Then, Model 3: The NKLC (a) Model • liK +1 and uiK +1 depend on pi(xiK) and a • where 0 a 1 is the cooperational skill level of the leader Define When a 0, liK +1 0 When a 1, liK +1pi(xi K )
Results of Model 3 • When a is small, the performance decreases monotonically. • As a increases, the performance curves move up. • A more skillful leader can manage more interaction • without adversely affecting team performance, thus, • attenuating the interaction catastrophe.
Future Research • Emergence of a Hierarchical Structure • Develop a hierarchical team model that reflects the structure of organization. • Study how the leaders at different levels affect each other and the team performance. • Emergence of a Leader and Team Splitting • Study how a leader is recognized. • Study how large a team should be when split.
Future Research (Cont’d) • Other Topics • Develop a mathematical model that includes • simultaneously two or more roles played by • the leader. • Study the role of the leader in the • worker-replacement process, for example, • in deciding who to replace.