Download
1 / 49
530 likes | 790 Views
Technical Debt. CS 510 Software Engineering Supannika Koolmanojwong. Outline. Total Cost of Ownership Technical Debt. What are the cost of a software?. Think about the whole life cyle. Total cost of ownership.

E N D
Technical Debt CS 510 Software Engineering Supannika Koolmanojwong
Outline Total Cost of Ownership Technical Debt
What are the cost of a software? Think about the whole life cyle
Total cost of ownership • a financial estimate whose purpose is to help consumers and enterprise managers determine direct and indirect costs of a product or system. • including the costs to research, develop, acquire, own, operate, maintain, and dispose of a system
Potential total cost of ownership • HW and SW • Network • Server • Workstation • Installation & integration • Purchasing research • Warranties and licenses • License tracking - compliance • Migration expenses • Risks: susceptibility to vulnerabilities, availability of upgrades, patches and future licensing policies, etc. • Infrastructure • Electricity • Testing costs • Downtime, outage and failure expenses • Diminished performance • Security (including breaches, loss of reputation, recovery & prevention) • Backup and recovery process • Technology training • Audit • Insurance • IT personnel • Replacement • Future upgrade or scalability expenses • Decommissioning
Relative* Total Ownership Cost (TOC)For single system life cycle (TOC-SS) ~5% architecture investment ~5% architecture investment ~25% architecture investment * Cumulative architecting and rework effort relative to initial development effort
CodeSmell Deficit programming Code Debt Technical Debt Software Decay coined by Ward Cunningham Design Debt Technical Inflation
Technical DebtBy Ward Cunningham http://www.youtube.com/watch?v=pqeJFYwnkjE&feature=player_embedded#!
Technical Debt “is a measure of how untidy or out-of-date the development work area for a product is” Not the deferred requirements http://www.c2.com/cgi/wiki?TechnicalDebt
Technical Debt http://petdance.com/perl/technical-debt “I don’t know what happened, I just changed one line” “We can’t upgrade, It will break” “We can’t upgrade the code, we don’t have time” “We can’t upgrade the code, no one understands it” “Just put in the comment XXX, we will do it later” “Just put in the TODO comment”
Financial debt vsTechnical Debt http://martinfowler.com/bliki/TechnicalDebt.html
http://pkruchten.files.wordpress.com/2011/10/kruchten-111027-techdebt.pdfhttp://pkruchten.files.wordpress.com/2011/10/kruchten-111027-techdebt.pdf
Technical Debt • intentional technical debt • cost to taking short cuts • unintentional technical debt • making mistakes • Conscious decision to optimize for the “present” rather than the “future” • cost of not dealing with these short cuts and mistakes will increase over time. Read more: http://www.javacodegeeks.com/2012/02/technical-debt-how-much-is-it-really.html#ixzz1phjvB5A9
Common causes of technical debt Business pressures Lack of process or understanding Lack of building loosely coupled components (hard-coded) Lack of documentation Parallel Development Delayed Refactoring http://en.wikipedia.org/wiki/Technical_debt
Technical DebtArchitecture or the platform technology mistake Read more: http://www.javacodegeeks.com/2012/02/technical-debt-how-much-is-it-really.html#ixzz1phnGFlUV Scalability, reliability Foundations are poorly design you don’t find out until too late (operations phase) no choice but to start again or rewrite big chunk to keep it working
Technical DebtError-prone code Read more: http://www.javacodegeeks.com/2012/02/technical-debt-how-much-is-it-really.html#ixzz1phnGFlUV http://petdance.com/perl/technical-debt/technical-debt.007.html “ .. If I change X, it is going to break Y, I think ..” “ Don’t touch that code, last time we did, we spent a week fixing it…” 20% of the code where 80% of bugs are found Hard to understand Dangerous to change because done poorly one in the first place Not rewriting this code is one of the most expensive mistakes that developers make
Technical DebtNot easily tested Read more: http://www.javacodegeeks.com/2012/02/technical-debt-how-much-is-it-really.html#ixzz1phnGFlUV “ .. I thought we had a test for that ..” Don’t have good automated tests Tests keep falling apart when you change the code Testing costs tend to go up over time as you write more code
Technical DebtCode that mysteriously works Read more: http://www.javacodegeeks.com/2012/02/technical-debt-how-much-is-it-really.html#ixzz1phnGFlUV nobody is sure how or why Might be written by the geek who left the company if nobody on the team understands it, it’s a time bomb
Technical DebtOthers Read more: http://www.javacodegeeks.com/2012/02/technical-debt-how-much-is-it-really.html#ixzz1phnGFlUV • Forward and backward compatibility • Short term debt • Duplicate, copy-and-paste code • How many ? Trackable ? • Hard coding • Out of date documentation • “We just lost the drive, where are the backups” • If nobody is using it, get rid of it. If people are using it, why isn’t it up to date?
Technical Debt Cost average $3.61 to $5.42 per line of code. Example of Technical Debt Calculation http://docs.codehaus.org/display/SONAR/Technical+Debt+Calculation
Technical Debt Observations“Agile Project Management”, Jim Highsmith, second edition
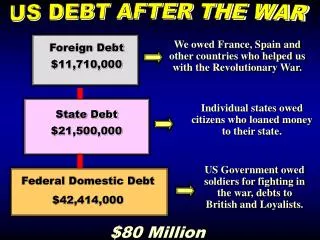
Committed Costs 95% 85% 500X-1,000X 70% Cost to Extract Defects 20X-100X 3X-6X The Cost of Undetected Defects Operation Disposal 100% 100% 90% 80% 70% 60% Production/Test Cumulative Percentage of Life-Cycle Cost 50% 50% 40% 30% Development 20% Design 20% Concept 15% 10% 8% 0% Reference: Defense Systems Management College (DAU) Time
Development Cost(Perfect World) % Effort per Phase Analysis Test Integration Design Implementation
Typical Defect Profiles Classification of Defects Design Defects Implementation Defects Integration Defects Analysis Test Integration Design Implementation Defect Insertion Defect detection & Removal
Development Cost(Real World) % Effort per Phase Analysis Test Integration Design Implementation
Development Cost % Effort per Phase Analysis Test Integration Design Implementation Real world Perfect World
Development Cost Technical Debt? Technical Debt? % Effort per Phase Technical Debt? Technical Debt? Analysis Test Integration Design Implementation Real world Perfect World
Development Cost Technical Debt? % Effort per Phase Technical Debt? Analysis Test Integration Design Implementation Real world Perfect World
COTS Integration % Effort per Phase Technical Debt? Analysis Test Integration Design Implementation Real world Perfect World
Technical Debt http://www.youtube.com/watch?v=xyJvDbEjtYw
Fixing technical debt • 80/20 rule • 20% initial build • 80% clean up
Fixing technical debt http://www.javacodegeeks.com/2011/11/dealing-with-technical-debt.html#ixzz1pjQ8bQpF • Big Bang • no new features for a year? Really? • spend some time cleaning up the mess • Good ? • Dedicated Team • Have another team dedicated • Good ? 80/20 rule ? • Boy Scout • remove technical debt little and often • If no tests, add some. If poor test, improve them. If bad code, refactor it • The boy scout rule – leave the camp cleaner than you found it
Fixing technical debt • Think time & risk & $$$ • No gold-plating • Unnecessary task that no one wants • BigResearchUpFrontvsBigDesignUpFront
Technical Debt vs Agile : Bad http://www.startuplessonslearned.com/2009/07/embrace-technical-debt.html • Quick and dirty approach • Scalability vsDoTheSimplestThingThatCouldPossiblyWork • Just-in-time Scalability • change the architecture in response to actual customer demand • Wasted Code
Technical Debt vs Agile : Good http://www.startuplessonslearned.com/2009/07/embrace-technical-debt.html Get feedback faster Smaller batches
Technical Debt vs Lean : Good http://www.startuplessonslearned.com/2009/07/embrace-technical-debt.html Less waste, less debt Just-in-time nature
Technical Debt vs NDI : Bad http://www.startuplessonslearned.com/2009/07/embrace-technical-debt.html • Product Development Leverage • Your product is fortified by others • Open-source, COTS, Services • Pros: Faster • Cons • Code understanding • Different coding styles, architecture, quality • No direct control
http://pkruchten.files.wordpress.com/2011/10/kruchten-111027-techdebt.pdfhttp://pkruchten.files.wordpress.com/2011/10/kruchten-111027-techdebt.pdf
http://pkruchten.files.wordpress.com/2011/10/kruchten-111027-techdebt.pdfhttp://pkruchten.files.wordpress.com/2011/10/kruchten-111027-techdebt.pdf
http://pkruchten.files.wordpress.com/2011/10/kruchten-111027-techdebt.pdfhttp://pkruchten.files.wordpress.com/2011/10/kruchten-111027-techdebt.pdf
Information Categories - Measurable Concepts Product Quality • Functional Correctness • Supportability - Maintainability • Efficiency • Portability • Usability • Dependability - Reliability • Security - Safety Process Performance • Process Compliance • Process Efficiency • Process Effectiveness Technology Effectiveness • Technology Suitability • Technology Maturity • Technology Volatility • Technology Adoption Customer Satisfaction • Customer Feedback • Customer Support Schedule and Progress • Milestone Completion • Work Unit Progress • Work Backlog • Incremental Capability Resources and Cost • Financial Performance • Personnel Effort • Environment and Support Resources Size and Stability • Physical Size and Stability • Functional Size and Stability Source: “Introduction to PSM Course, Version 7.0”, July 30,2012, Portsmouth, VA Bob Epps, Technical Debt Workshop, PSM Conference
Information Categories - Measurable Concepts Product Quality • Functional Correctness • Supportability - Maintainability • Efficiency • Portability • Usability • Dependability - Reliability • Security - Safety Process Performance • Process Compliance • Process Efficiency • Process Effectiveness Technology Effectiveness • Technology Suitability • Technology Maturity • Technology Volatility • Technology Adoption Customer Satisfaction • Customer Feedback • Customer Support Schedule and Progress • Milestone Completion • Work Unit Progress • Work Backlog • Incremental Capability Resources and Cost • Financial Performance • Personnel Effort • Environment and Support Resources Size and Stability • Physical Size and Stability • Functional Size and Stability Measurable Concept Areas where “Intentional” Technical Debt may be found Source: “Introduction to PSM Course, Version 7.0”, July 30,2012, Portsmouth, VA Bob Epps, Technical Debt Workshop, PSM Conference
Activities during Operations & Maintenance(O&M) If each RFC has equal complexity you might expect this % Effort per Phase % Effort per Phase % Effort per Phase System Complexity RFC #2 RFC #3 RFC #1 Imp Imp Imp Test Test Test Integ Integ Integ Analysis Analysis Analysis Design Design Design Time Source: Bob Epps, Technical Debt Workshop, PSM Conference 2012
Activities during Operations & Maintenance(O&M) Even if each RFC has different complexity , it still would be manageable. If maintainability is measured by the number of systems components changed for an RFC what is the ideal number of components changed? What dictates this number? System Complexity % Effort per Phase % Effort per Phase % Effort per Phase RFC #2 RFC #3 RFC #1 Imp Imp Imp Test Test Test Integ Integ Integ Analysis Analysis Analysis Design Design Design Time Source: Bob Epps, Technical Debt Workshop, PSM Conference 2012
Activities during Operations & Maintenance(O&M) However, experience shows that even when the RFCs have the same complexity the “aggregate” complexity of the system causes side effects which complicate future RFCs. RFC #3 System Complexity % Effort per Phase % Effort per Phase % Effort per Phase RFC #2 How is the phenomenon managed? RFC #1 Imp Imp Imp Test Test Test Integ Integ Integ Analysis Analysis Analysis Design Design Design Time Source: Bob Epps, Technical Debt Workshop, PSM Conference 2012
Activities during Operations & Maintenance(O&M) System Complexity % Effort per Phase % Effort per Phase % Effort per Phase % Effort per Phase % Effort per Phase % Effort per Phase When overlapping RFCs occur, coupled with side effects the control of the baseline(s) are in jeopardy . RFC #1 RFC #3 RFC #2 RFC # N-1 RFC # N RFC #4 Imp Imp Imp Imp Imp Imp Test Test Test Test Test Test Integ Integ Integ Integ Integ Integ Analysis Analysis Analysis Analysis Analysis Analysis Design Design Design Design Design Design Time Source: Bob Epps, Technical Debt Workshop, PSM Conference 2012
The bottom line • Trade off between • Technical Debt • Flexibility (Design for Reuse) • Expedition
References http://pkruchten.files.wordpress.com/2011/10/kruchten-111027-techdebt.pdf