Download
1 / 45
450 likes | 549 Views
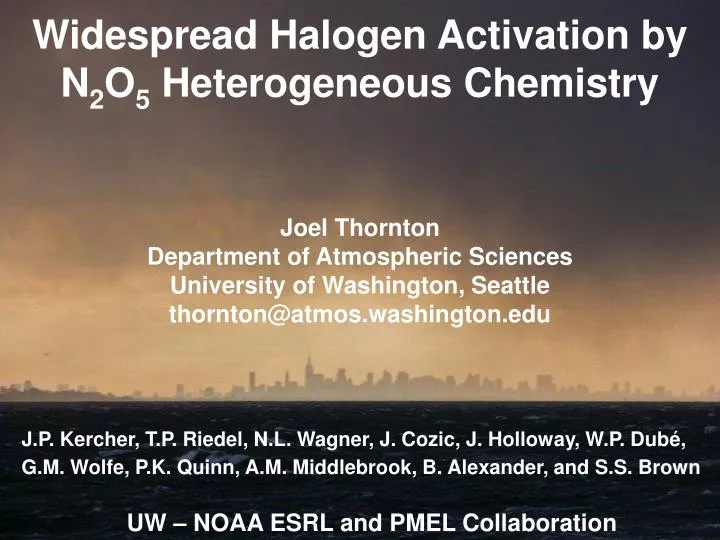
Widespread Halogen Activation by N 2 O 5 Heterogeneous Chemistry. Joel Thornton Department of Atmospheric Sciences University of Washington, Seattle thornton@atmos.washington.edu.

E N D
Widespread Halogen Activation by N2O5 Heterogeneous Chemistry Joel Thornton Department of Atmospheric Sciences University of Washington, Seattle thornton@atmos.washington.edu J.P. Kercher, T.P. Riedel, N.L. Wagner, J. Cozic, J. Holloway, W.P. Dubé, G.M. Wolfe, P.K. Quinn, A.M. Middlebrook, B. Alexander, and S.S. Brown UW – NOAA ESRL and PMEL Collaboration
Tropospheric Chlorine Cycling *From methane isotopes measured in remote SH MBL 25-35 Tg* Cl-X Cl Platt, ACP 2004 Allan, JGR 2007 activation CxHy acid displacement Cl- HCl Anthro. + 3 – 5 Tg sea spray ~10,000 Tg Graedel and Keene, GBC,1995
Chlorine Cycling: New Addition 8 – 22 Tg Cl yr-1 NO2 ClNO2 Cl activation CxHy acid displacement NO3 N2O5 HCl pCl- Reference: Thornton, et al Nature 2010
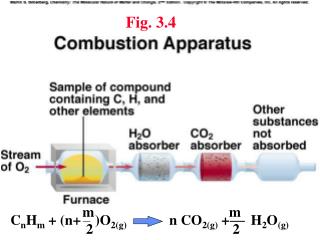
ClNO2 Production + HNO3(s) XNO2(s) HX(g) HX(s) References: Finlayson-Pitts et al. 1989; Behnke et al, 1989, 1992; Thornton and Abbatt, 2005; Bertram et al 2009; Raff et al 2009
Instantaneous ClNO2 Yield Cl- ClNO2 + NO3- N2O5(aq) 2HNO3 H2O References: Benkhe, et al JGR 1997; Roberts, et al GRL 2009; Bertram and Thornton, ACP 2009
Population Average Instantaneous ClNO2 Yield Equilibrium repartitioning Cl- HCl(g) Surface Area Distribution =0 =1 (rp) ~ 0.1 Total Chlorine = pCl- + HCl(g) References: Benkhe, et al JGR 1997; Roberts, et al GRL 2009; Bertram and Thornton, ACP 2009
ClNO2 as a Cl Atom Source “Top-down” global Cl atom source Allan, et al 2004 22 - 35 Tg Cl yr-1 Platt, et al 2004 ~ 35 Tg Cl yr-1 “Bottom up” global Cl atom source from ClNO2 Erickson et al 1996 0.06 Tg Cl yr-1(MBL only) Osthoff et al 2008 3.2 Tg Cl yr-1 (Coastal and MBL only) “Bottom up” local Cl atom source from ClNO2 Pechtl and von Glasow: ClNO2 < 50 ppt in Long Island Sound (during June)
UW-Chemical Ionization Mass Spectrometer CDC CH3I/ N2 Quadrupole I- + ClNO2 I-ClNO2- electron multiplier I- + N2O5 I-N2O5- IMR McNeill, et al Atmos. Chem. Phys. 2006 Kercher, et al Atmos. Meas. Tech. 2009 ~ 1-5 pptv in 1 second Octupole V. Faye McNeill (now at Columbia University) James P. Kercher (now at Hiram College) Theran P. Riedel (UW Graduate Student)
ClNO2 in the Long Island Sound and Beyond 53W 71W 63W 57W 1500ppt log([ClNO2]) Observed ClNO2 is 2 – 20x greater than previous model predictions for Long Island Sound (e.g. Pechtl and von Glasow, GRL 2007) ClNO2 production still evident in outflow 1 – 2 days downwind ClNO2 ~0.5
Psuedo-Lagrangian Model Predictions ppbv ClNO2 or N2O5 pptv NO2ppbv
Fraction of NOx Reacting via N2O5 W Sp Su Au GEOS-Chem output from B. Alexander ~ 38% of NOx removed by N2O5 over U.S.
ClNO2 and N2O5 in Boulder, CO* (*Parking Lot behind ESRL’s David H. Skaags Building) 35Cl (cps) 37Cl (cps)
ACCRONIM February 11 - 25 2009 Particle surface area Water-soluble particle composition Meteorology (RH, T, Winds) N2O5 and ClNO2 CO, O3 NO, NO2 Kohler Mesa, Boulder, CO Reference: Thornton, et al Nature 2010
Reactant and Product Relationships ClNO2 and N2O5 broadly correlated But relationship changes night-to-night and within a night
Total Chloride ClNO2 routinely 4 – 10x greater than particulate Cl-, suggesting important role for HCl(g) Consistent with observationally constrained thermodynamic aerosol model
Chemical Modeling Example -2 February 22nd-23rd ClNO2 over campaign ranged from ~ 7 – 36% ClNO2 ~0.18
Is Boulder Special? IMPROVE Network NADP Network nCl-/nNO3- fine mode mCl/mtotal Aerosol Inorganics Model nCl-/(fN2O5nNO3-)
Is Boulder Special? IMPROVE Network NADP Network Aerosol Chloride Based Yield Chloride moles per N2O5 moles reacted Aerosol Inorganics Model
Estimating ClNO2 Production over U.S. HNO3 LNOx fN2O5 NOx ClNO2 ENOx ENOx = LNOx PClNO2 =ClNO2fN2O5ENOx Constrain with Observations GEOS-Chem EDGAR Database
Estimating ClNO2 Production over U.S. Log(ENOx) fN2O5 ClNO2 Log(PClNO2) U.S. PClNO2 = 1.4 - 3.5 Tg Cl yr-1
ClNO2 and the Global Cl Atom Source “Top-down” total global Cl atom source Allan, et al 2004 22 - 35 Tg Cl yr-1 Platt, et al 2004 ~ 35 Tg Cl yr-1 “Bottom up” global Cl atom source from ClNO2 Erickson et al 0.06 Tg Cl yr-1 Osthoff et al 3.2 Tg Cl yr-1 MAP OF NO2 Our estimates 8 – 22 Tg Cl yr-1
Chlorine Cycling: New Addition 8 – 22 Tg Cl yr-1 NO2 ClNO2 Cl activation CxHy acid displacement NO3 N2O5 Cl- HCl Anthropogenic NOx represents a large perturbation of Cl-atom budget Cl-atom source tied to our understanding of N2O5 reactive uptake Nighttime chemistry not just a sink of Ox – but a potential source
Implications: e.g. Wintertime Oxidants ClNO2 = 600 pptv ClNO2 = 350 pptv ClNO2 = 0 pptv For 600 pptv ClNO2 in February Cl + RH dominates HOx production (by >10x) from sunrise to 10AM Cl + RH leads to >30% more daytime HOx production Figure 4
Some Outstanding Issues • Studies of wintertime nocturnal reactive nitrogen and morning HOx chemistry • HCl measurements are likely necessary to demonstrate “closure” between integrated LN2O5 and PClNO2 • ClNO2 yields inferred from [N2O5] and [ClNO2] are often lower than predictions based on [pCl-] • Chloride distribution? Phase? Losses of N2O5 and/or ClNO2? • 4. Can we better validate/constrain fN2O5?
Where does the chloride in come from? Sea Spray Coal Burning Biomass/crop burning Biofuel Waste incineration (e.g. PVC) Playa dust Road salt (?) Cooling towers Swimming pools (?)… References: Graedel and Keene, 1995; Reff, et al, 2009
Predicting Annual Average U.S. PClNO2 Log(ENOx) fN2O5 ClNO2 Log(PClNO2) U.S. PClNO2 = 1.4 - 3.5 Tg Cl yr-1
Measured Chloride Deposition Log(mCl) kg ha-1 yr-1 From the National Atmospheric Deposition Program (NADP)
Aerosol Chloride is Ubiquitous Q. Zhang, et al GRL 2007 ClNO2>90% ClNO2>50%
NOx, Air Quality, and Climate Forcings Catalyze ozone production NOx Regulate oxidant abundance Shindell, et al Science 2009 NOx emissions couple air quality and climate concerns
Chlorine Activation by N2O5: Model Predictions • 1996 Erickson, et alJGR • Global ClNO2 Production From Sea Spray 0.06 Tg Cl/yr • 2007 Pechtl and von Glasow, GRL • Chlorine Activation in Long Island Sound Maximum ClNO2 mixing ratio ~ 50 pptv (only on “first night”) 1-2 days downwind negligible Always less than 5% of Cl atom source
Atomic Chlorine: powerful oxidant oxidant CH4 CH4+ OH Products CH4 + Cl Products 0.05 ppt ~10 years 0.05 ppt 0.5 years
Tropospheric Cl atoms We know they exist, but their sources, distribution, and abundance are poorly constrained Baring Head, New Zealand Jobson, et al JGR 1994 Platt, et al ACP 2004
Where there’s chloride for ClNO2 production ClNO2 Yield U.S. IMPROVE Network fine-mode particle chloride Chlorine Availability: [Cl-] / f[NO3-] From U.S. NADP precipitation Cl- and NO3-
Current Constraints from ClNO2 Observations 1. TexAQS – GoMACCS [ClNO2] ~ 50 - > 1000 ppt Osthoff, et al, Nature Geo. 2008 2. ICEALOT-LILAQS [ClNO2] ~ 50 - > 1000 ppt Kercher, et al, AMT 2009 3 3. ACCRONIM-Boulder, CO [ClNO2] ~ 50 – 450 Thornton, et al submitted2009 2 1
Current Constraints from ClNO2 Observations 1. TexAQS – GoMACCS [ClNO2] ~ 50 - > 1000 ppt Osthoff, et al, Nature Geo. 2008 2. ICEALOT-LILAQS [ClNO2] ~ 50 - > 1000 ppt Kercher, et al, AMT 2009 3 3. ACCRONIM-Boulder, CO [ClNO2] ~ 50 – 450 pptv Thornton, et al submitted2009 2 1
Where there’s NOx Courtesy of NASA GSFC
Chlorine Activation by N2O5 Cl NO2 2HNO3 H2O N2O5 Cl- HNO3 + ClNO2 Finlayson-Pitts, Nature 1989 Benkhe, et al JGR 1997
Tropospheric Chlorine Cycling *From methane isotopes measured in remote SH MBL 22-35 Tg* Cl-X Cl Platt, ACP 2004 Allan, JGR 2007 activation CxHy acid displacement Cl- HCl Anthro. + 3 – 5 Tg sea spray ~10,000 Tg Graedel and Keene, GBC,1995
Chemical Modeling Example - 1 Feb 15 – 16th -highest ClNO2 -low winds -constant yield captures ClNO2 growth ClNO2 ~0.14