Download
1 / 24
280 likes | 459 Views
Prediction of bottom water drive reservoir performance. Prediction of bottom water drive reservoir performance. Determine We from MBE Calculate the values of Sum dp Qt from Unsteady state water drive

E N D
Prediction of bottom water drive reservoir performance • Determine We from MBE • Calculate the values of Sum dp Qt from Unsteady state water drive • We can obtained the values of B from the equating We from MBE with B Sum dp Qt • The best value of B obtained from drawing the relation between values of B versus Values of Np or time • OR
OR B From MBE straight line This equation of straight line relation between F and E the slope is B
5. Assume three values of Pressure P1,P2 & P3,and Select the values of Production Np ,Wb,..on the basis of the past production history 6. From PVT data Determine Bo,Bt,….. 7. Calculate the values of We from MBE for each pressure 8. Plotting pressure Vs water influx calculated by both MBE and USSE obtained for the three assumed pressures will show the pressure which will result in identical water influx calculation by both method. 9. The intersection of the two We MBE and We fro USSE curves yields the proper pressure 10. Repeat the above steps until abandonment pressure or the time of prediction. Neglecting Cw & Cf
If the pressure less than the saturation pressure Also, we obtained We From unsteady state and continue the same last steps
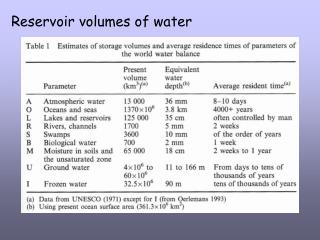
Example 1 • A water drive reservoir is an elongated dome with water influx around the entire periphery ( angle =360) of the reservoir. Table below shows the data required. Also given the following N= 34 MMSTB, Pi=2265 Psia Pb= 1135 Psig water viscosity = 0.68 Cp, Porosity = 20 %, Permeability = 100 md, rw=4500 ft, re/rw=4, Ce= 14.x10-6 psi-1. rsi= 192 SCF/STB
Calculate the reservoir pressure at 54 months (considering that Np and Wp at this time are 1.705 MM STB and 160 M STB respectively.
Solution • Neglecting (Cf &Cw effect) above Pb
As Example step one • We MBE at 2115= (110,000)(1.1025)+5000-34000000(1.1025-1.1019) = 88500 bbls • We from Unsteady state
Draw graph between B and Np or Time • The best value of constant B from the graph is 300
Prediction of the reservoir performance • Assume P ; 1340 , 1300 and 1200 > Pb • From P.V.T dat • Bt; 1.1087 1.1090 and 1.1099 • Using U.S.S.E
Plotting pressure Vs water influx calculated by both MBE and USSE obtained for the three assumed pressures will show the pressure which will result in identical water influx calculation by both method. • The intersection of the two We MBE and We fro USSE curves yields the proper pressure Ans. Pcorrect = 1218 psi • We = 1.769 x10 6 bbls