Download
1 / 27
270 likes | 379 Views
AOSC 200 FALL 2011. Everybody talks about the weather but nobody does anything about it. - Charles Dudley Warner. AOSC 200 Weather and Climate Lecture Time and Location: There are two sessions of lectures for this course.

E N D
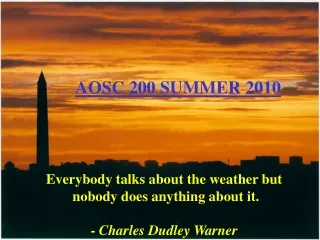
AOSC 200 FALL 2011 Everybody talks about the weather but nobody does anything about it. - Charles Dudley Warner
AOSC 200 Weather and Climate Lecture Time and Location: There are two sessions of lectures for this course. Session 1 12.30 pm – 1.45 pm on Tuesdays and Thursdays in CSS2324 Session 2 2.00 pm – 3.15 pm on Tuesdays and Thursdays in PHY1412 Discussion Time and Location For Session 1: 0101 Wednesday 1.00 pm to 1.50 pm in CSS 2428 0102 Wednesday 2.00 pm to 2.50 pm in CSS 2428 0103 Wednesday 3.00 pm to 3.50 pm in CSS 2428 0104 Wednesday 1.00 pm to 1.50 pm in PLS 1146 For Session 2 0201 Wednesday 2.00 pm to 2.50 pm in CHM 1228 0202 Wednesday 3.00 pm to 3.50 pm in KEB 1200 0203 Monday 1.00 pm to 1.50 pm in CSS 2428 0204 Monday 2.00 pm to 2.50 pm in CSS 2428 Textbook: Meteorology: Understanding the Atmosphere, by Ackerman and Knox
TA’s • 0101, 0104,Stephen Baxter, sbaxter@atmos.umd.edu • 0204, Ben Johnston, aosc200ben@yahoo.com • 0201, 0202, Allison Monarski, amonarck@umd.edu • 0203, Jordan Foley, jfoley@atmos.umd.edu • 0102, 0103, Dr. Jeffrey Stehr, stehr@atmos.umd.edu
AOSC 200 Weather and Climate • Course website www.atmos.umd.edu/~hudson/aosc200.d • Contains: • Each lecture in Power-point format on web page. Go to AOSC200 LECTURES user name: aosc200 password: aosc200f09 • Syllabus and class schedule • The projects • All class information will be posted on the website. • A weather forecasting primer can be found at www.atmos.umd.edu/~hudson/forecastchecklist.htm
Grading • The course will be graded on the basis of a mid-term exams (25% of the final grade) , a final exam(30% of the final grade), three projects (25% of the final grade), and 6 quizzes (20% of the final grade). • The projects will be group efforts. Students in each discussion section will be assigned to groups of from five to six students. • The subject of each project will be the application of weather/climate to our every day lives, e.g. prepare a poster on ’The impact of climate forecasting on the commodities market’. • The projects are in lieu of homework, students are expected to work on the project outside of classroom hours. Also 20 minutes of each discussion session will be allocated to group meetings.
Projects • Work on the projects will be in three stages: • (1) An outline of the product and group assignments (20%) • (2) A draft of the product for comments • (3) The final product.(50%) • (4) Presentation (30%) • Each group member will also be asked to grade the other members of the group on their overall contribution to the project.
Who am I? • My PhD was in Physics. My research thesis was in Spectroscopy. Each molecule or atom emits and absorbs radiation in unique regions – like a finger print. One can use this fact to identify the molecule or atom. • Before joining UM in 1990, I worked for NASA developing instruments to identify atmospheric molecules from satellites. • It was at NASA that I became an atmospheric physicist • Research on the Ozone layer in the Stratosphere. • Current research is on applying this ozone data to climate studies.
http://www.youtube.com/watch?v=YfcNRWefEEUhttp://www.youtube.com/watch?v=YfcNRWefEEUhttp://www.youtube.com/watch?v=YfcNRWefEEUhttp://www.youtube.com/watch?v=YfcNRWefEEU
Hurricane Irene http://abcnews.go.com/US/hurricanes/hurricane-irene-dead-million-power/story?id=14393026http://abcnews.go.com/US/hurricanes/hurricane-irene-dead-million-power/story?id=14393026
BLUE MARBLE ROTATING http://www.youtube.com/watch?v=CEe8vzJjj3M&feature=relatedhttp://www.youtube.com/watch?v=CEe8vzJjj3M&feature=related
Weather Satellite Image, July 7, 2005 Fig. 1-1, p. 2
Weather Instantaneous description of what the atmosphere is doing at a particular time and place Climate Description of what weather is usually like in a region (large or small). Not just the average weather, but a description of what the extremes are like too. Weather vs. Climate
Different hemispheres – different weather Why? Different ratios of land to oceans. Oceans tend to act like a thermostat. Mountains cause instabilities in the air flow. Southern hemisphere is calmer. Fig. 1-2, p. 3
Mean Percentage of possible sunshine for November Typical Weather Map Typical Climatology Map
FRONTS • You will often hear TV meteorologists refer to cold and warm fronts when describing the weather. • Fronts are regions where cold and warm air masses meet. • This is the region where most of the ‘weather’ is generated. • We identifiy four main classes of fronts, warm, cold, stationary, occluded. • Each front has an unique symbol on weather maps.
Warm Front Fig. 9.13
Cold front Fig. 9.15
Weather Symbols Fig. 1-17, p. 21
Detailed weather symbols (1) Direction of arrow into the circle gives the wind direction. Number of barbs on the arrow gives the wind speed. Full barb = 10 miles per hour, half barb=5. (2) Sign, middle left, gives the type of precipitation. In the top left symbol the sign is fot thunder. In the bottom left it stands for steady rain. (3) Shading in inner circle gives the cloud fraction. (4) Top number on left is the temperature, bottom number the dew point
Weather symbols • The numbers at top right of each symbol represent the pressure in millibars (mb) • The pressure seldom drops below 950 mb and seldom gets above 1049 mb • In the days of teletype the object was to shorten the amount of information sent. • So if I say the pressure was 98 then the receiver could assume that I meant 998. And if I sent 14 then 1014 was assumed. • To further confuse the issue it was decided to sent the tenth of a mb. So now if I sent 998 I meant 999.8. Similarly 117 means 1011.7.
Weather Forecasting • A website has been prepared to guide you through the process of making a simple weather forecast. • You can either go to Dr. Hudson’s web page and then click on: Forecast Checklist • Or go to: http://www.atmos.umd.edu/~hudson/forecastchecklist2.htm