Download
1 / 33
380 likes | 679 Views
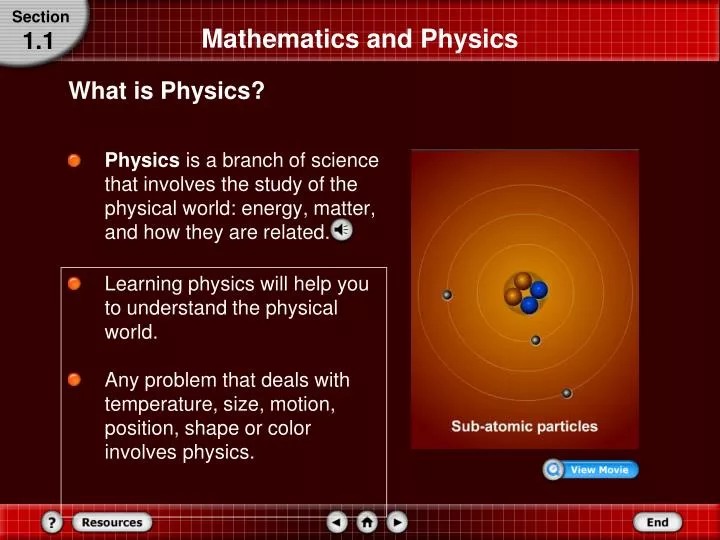
Section. Mathematics and Physics. 1.1. What is Physics?. Physics is a branch of science that involves the study of the physical world: energy, matter, and how they are related. Learning physics will help you to understand the physical world .

E N D
Section Mathematics and Physics 1.1 What is Physics? • Physics is a branch of science that involves the study of the physical world: energy, matter, and how they are related. • Learning physics will help you to understand the physical world. • Any problem that deals with temperature, size, motion, position, shape or color involves physics.
Review Questions: • 1. Identify the area of physics that is most relevant to each of the following situations. Explain your reasoning. • A. High school football game • B. Food preparation for the prom • C. Playing in the school band • D. Lightning in a thunderstorm • E. Wearing sunglasses outside in the sun
Question #1 Answer • A. High school football game: mechanics • B. Food preparation for the prom: thermodynamics • C. Playing in the school band: waves • D. Lightning in a thunderstorm: electromagnetism • E. Wearing sunglasses outside in the sun: optics
Question #2 • Identify the area of physics involved in each of the following tests of a lightweight metal alloy proposed for use in sailboat hulls: • A. Testing the effects of a collision on the alloy • B. Testing the effects of extreme heat and cold on the alloy • C. Testing whether the alloy can affect a magnetic compass needle
Answer #2 • A. Testing the effects of a collision on the alloy: mechanics • B. Testing the effects of extreme heat and cold on the alloy: thermodynamics • C. Testing whether the alloy can affect a magnetic compass needle: electromagnetism
Section Mathematics and Physics 1.1 SI Units • The Système International d’Unités, or SI, uses seven base quantities, which are shown in the table below.
Measurement Derived units • Area – square meter, m2 • Volume – cubic meter, m3 • Force – newton, N • Pressure – pascal, Pa • Energy – joule, J • Power – watt, W • Voltage – volt, V • Frequency – hertz, Hz • Electric charge – coulomb, C
Section Mathematics and Physics 1.1 SI Units • Measuring standards for kilogram and meter are shown below. • International Bureau of Weights and Measures in Sèvres, France and the National Institute of Science and Technology (NIST) in Gaithersburg, Maryland • http://www.surveyhistory.org/the_standard_meter1.htm
Great (giga) Magnificent (mega) King (kilo) Hector (hecto) Drinks (deka) Ultra (unit) Delicious (deci) Chocolate (centi) Milk (milli) Most (micro) Nights (nano) Mnemonic device for remembering prefixes
1. 30 Gm = ___ µm 2. 1 Mg = ___ ng 3. 0.052 mL = ___ ML 4. 0.58 Mm = ___ nm 5. 597 ng= ____ mg Conversion practice
Section Mathematics and Physics 1.1 Dimensional Analysis • This method of treating the units as algebraic quantities, which can be cancelled, is called dimensional analysis. • Dimensional analysis also is used in choosing conversion factors. • A conversion factor is a multiplier equal to 1. For example, because 1 kg = 1000 g, you can construct the following conversion factors:
Section Section Check 1.1 Question 1 The potential energy, PE, of a body of mass, m, raised to a height, h, is expressed mathematically as PE = mgh,where g is the gravitational constant. If m is measured in kg, g in m/s2, h in m, and PE in joules, then what is 1 joule described in base unit? • 1 kg·m/s • 1 kg·m/s2 • 1 kg·m2/s • 1 kg·m2/s2
Section Section Check 1.1 Answer 1 Answer:D Reason:
Section Section Check 1.1 Question 2 A car is moving at a speed of 90 km/h. What is the speed of the car in m/s? (Hint: Use Dimensional Analysis) • 2.5×101 m/s • 1.5×10³ m/s • 2.5 m/s • 1.5×10² m/s
Section Section Check 1.1 Answer 2 Answer:A Reason:
Section Section Check 1.1 Question 3 Which of the following representations is correct when you solve 0.030 kg + 3333 g using scientific notation? • 3.4×10³ g • 3.36×10³ g • 3×10³ g • 3363 g
Section Section Check 1.1 Answer 3 Answer:A Reason:0.030 kg can be written as 3.0 101 g which has 2 significant digits, the number 3 and the zero after 3. In number 3333 all the four 3’s are significant hence it has 4 significant digits. So our answer should contain 2 significant digits.
Section Mathematics and Physics 1.1 Significant Digits • A meterstick is used to measure a pen and the measurement is recorded as 14.3 cm. • This measurement has three valid digits: two you are sure of, and one you estimated. • The valid digits in a measurement are called significant digits. • However, the last digit given for any measurement is the uncertain digit.
Section Mathematics and Physics 1.1 Scientific Methods • Observe (this may lead to or be the result of a question) • A scientist often works with an idea that can be worded as a hypothesis, which is an educated guess about how variables are related. • Test with an experiment (record & analyze all data) • Draw a conclusion from experiment (may lead to new hypothesis & more experiments)
Section Mathematics and Physics 1.1 Models, Laws, and Theories • A scientific law is a rule of nature that sums up related observations to describe a pattern in nature. • A scientific theory is an explanation based on many observations supported by experimental results.
Section Graphing Data 1.3 Identifying Variables • The independent variable is the factor that is changed or manipulated during the experiment. (x axis) • The dependent variable is the factor that depends on the independent variable. (y axis)
Section Graphing Data 1.3 Linear Relationships • When the line of best fit is a straight line, the dependent variable varies linearly with the independent variable.
Section Graphing Data 1.3 Nonlinear Relationships: Quadratic Relationship • A quadratic relationship exists when one variable depends on the square of another.
Section Graphing Data 1.3 Nonlinear Relationships: Inverse Relationship • In an inverse relationship,a hyperbola results when one variable depends on the inverse of the other.
Section Section Check 1.3 Question 1 Which type of relationship is shown following graph? • Linear • Inverse • Parabolic • Quadratic
Section Section Check 1.3 Answer 1 Answer:B Reason:In an inverse relationship a hyperbola results when one variable depends on the inverse of the other.
Section Section Check 1.3 Question 2 What is line of best fit? • The line joining the first and last data points in a graph. • The line joining the two center-most data points in a graph. • The line drawn close to all data points as possible. • The line joining the maximum data points in a graph.
Section Section Check 1.3 Answer 2 Answer:C Reason:The line drawn closer to all data points as possible, is called a line of best fit. The line of best fit is a better model for predictions than any one or two points that help to determine the line.