Download
1 / 13
130 likes | 243 Views
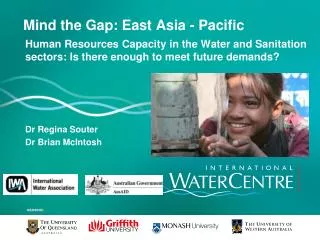
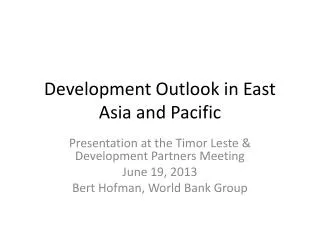
Resource Needs for East Asia and Pacific Infrastructure 2005-2010 Bali Workshop June 28,2004. Jonathan Walters (econometric analysis: Tito Yepes) The World Bank. Projection of physical infrastructure stocks, based on econometric models.

E N D
Resource Needs for East Asia and Pacific Infrastructure 2005-2010Bali WorkshopJune 28,2004 Jonathan Walters (econometric analysis: Tito Yepes) The World Bank
Projection of physical infrastructure stocks, based on econometric models. • Changes in stock levels (investment) is then valued at “best practice costs” – investment is assumed to be efficient • Annual maintenance expenditures are estimated as a fixed percentage of stock of infrastructure valued at same prices. Methodology of Estimation
Sector Coverage • Included: electricity grids, major roads (paved only), railroads, water and sanitation, telecommunications systems • Excluded (for lack of data): off-grid power, gas grids, mass transit, ports, unpaved/minor/urban roads, airports
Expanding from Sample to EAP Region • Projections were made for the 8 countries with sufficient historical data. (China, Malaysia, Philippines, Thailand, Indonesia, Laos, PNG, Mongolia). • Those countries account for 98% of EAP GDP • Totals for EAP countries outside the sample were obtained by assuming those countries were like sample countries in same class
Annual Investments and Maintenance in the Rest of East Asia2005-2010
Annual Investments and Maintenance in East Asia Middle Income Countries2005-2010
Annual Investments and Maintenance in East AsiaLow Income Countries2005-2010
Headline Numbers • EAP bill is US$ 300 billion+ per year • Which equals 11% of EAP GDP • China alone needs US$ 250 billion or 13.6% of its GDP • Middle income countries (w/o China) need 5.4% of GDP • Low income countries need 7% of GDP • Telecommunications is 55% of the EAP total • All numbers are approximations!
How to fund US$ 300 billion+ Three questions: • How to keep the bill down to US$ 300 billion? how to make investment efficient (public sector reform or private participation)? • How to get the funding up to US$ 300 billion? Cost recovery (tariffs, user charges) Tax-financed subsidies (how much fiscal space?) Loans to postpone the tax or tariff burden (role of domestic and international financial sector?) Donors (US$ 8-10 billion?) Private capital (US$ 15-40 billion?) • How much extra to achieve MDGs?