Download
1 / 22
220 likes | 310 Views
Overview of the Air Quality Applied Sciences Team Loretta J. Mickley, Harvard University. NASA Health and Air Quality Applications Program Review Sept. 18-20, 2012 Newport RI. Air Quality Applied Sciences Team (AQAST).

E N D
Overview of the Air Quality Applied Sciences TeamLoretta J. Mickley, Harvard University NASA Health and Air Quality Applications Program Review Sept. 18-20, 2012 Newport RI
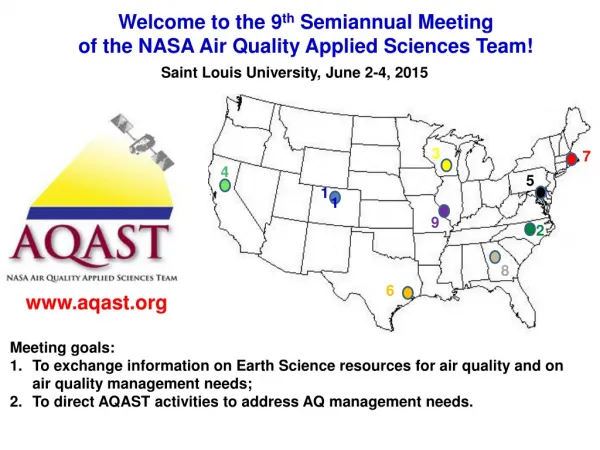
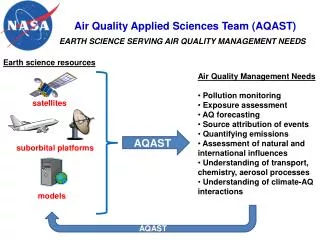
Air Quality Applied Sciences Team (AQAST) NASA initiative, begun in 2011, builds a bridge between Earth science resources and air quality management needs. Earth science resources • Air Quality Management Needs • Pollution monitoring • Exposure assessment • AQ forecasting • Source attribution of events • Quantifying emissions • Nat & foreign influences • AQ processes • Climate-AQ interactions satellites AQAST suborbital platforms models
Daniel Jacob (leader), Loretta Mickley(Harvard) • Greg Carmichael (U. Iowa) • Dan Cohan (Rice U.) • Russ Dickerson (U. Maryland) • Bryan Duncan, Yasuko Yoshida, Melanie Follette-Cook (NASA/GSFC); Jennifer Olson (NASA/LaRC) • David Edwards (NCAR) • Arlene Fiore (NOAA/GFDL); Meiyun Lin (Princeton) • Jack Fishman, Ben de Foy (Saint Louis U.) • DavenHenze, Jana Milford (U. Colorado) • Tracey Holloway, Steve Ackerman (U. Wisconsin); Bart Sponseller (Wisconsin DRC) • Edward Hyer, Jeff Reid, Doug Westphal, Kim Richardson (NRL) • Pius Lee, TianfengChai (NOAA/NESDIS) • Yang Liu, Matthew Strickland (Emory U.), Bin Yu (UC Berkeley) • Richard McNider, ArastooBiazar (U. Alabama – Huntsville) • Brad Pierce (NOAA/NESDIS) • Ted Russell, YongtaoHu, TalatOdman (Georgia Tech); Lorraine Remer (NASA/GSFC) • David Streets (Argonne) • Jim Szykman (EPA/ORD/NERL) • Anne Thompson, William Ryan, SuellenHaupt (Penn State U.) AQAST members Present at this meeting.
AQAST organization • AQAST supports two types of projects: • Investigator Projects (IPs) -- core funding toindividual members • Tiger Team Projects (TTPs) – collaborations between AQAST members with supplementary funding to address urgent air quality management needs. • All AQAST projects bridge Earth Science and air quality management: • Use Earth Science resources with clear air quality management outcomes. • Team up with partners in air quality management. • AQAST has flexibility in how it allocates its resources • Members can adjust their IPs to meet evolving air quality needs • Proposed Tiger Teams compete annually for funding to address the most pressing needs. • The team is self-organizing and can respond quickly to demands. Quick, collaborative, flexible, responsive to the needs of the AQ community.
Partner agency SIP Modeling AQ processes Monitoring AQ-Climate Background IC/BC for AQ models Forecasting Emissions Future satellites • Local: RAQC, BAAQD • State: TCEQ, MDE, • Wisconsin DNR, CARB, • Iowa DNR, GAEPD, GFC • Regional: LADCO, EPA Region 8 • National: EPA, NOAA, • NPS Scope of current AQAST projects Theme Satellites: MODIS, MISR, MOPITT, AIRS, OMI, TES, GOES Suborbital: ARCTAS, DISCOVER-AQ, ozonesondes, PANDORA Models: MOZART, CAM AM-3, GEOS-Chem, RAQMS, STEM, GISS, IPCC Earth Science resource
Background ozone estimates for EPA Integrated Science Assessment Annual 4th highest value of North American background ozone from GEOS-Chem model. [Zhang et al., AE 2011] AQAST Year 1 Highlight: Annual maximum influence from stratospheric ozone, calculated by the GFDL AM-3 model and validated with observations. Stratospheric intrusions can contribute to ozone exceedances. [Lin et al., 2012a]. Correlation between AIRS satellite observations of CO over Pacific and the Asian ozone influence over western US two days later. Satellite CO as an early warning indicator of Asian pollution [Lin et al., 2012b]. R AQAST PIs: A.M. Fiore, D.J. Jacob
AQAST Year 1 Highlight: Using satellite observations to monitor NOx emission growth in China and India OMI NO2 tropospheric columns, Ratio of 2007 / 2005 values. Circles are new power plants. Capacities of coal-fired power generation increased ~50%. [Wang, Streets, et al., 2012] Ratio OMI NO2 tropospheric columns over Indian power plants regions,1996-2010 The observed 70% increase is consistent with a bottom-up emission inventory. [Lu and Streets, 2012] 2011 1993 AQAST PI: D.G. Streets
Oil sand recovery In Alberta OMI NO2 columns, 2004-2010 AQAST Year 1 Highlight : Using satellite observationsto monitor growth in emissions from Canadian oil sands Oil sand extraction requires much energy to extract and upgrade the bitumen. Observations show an increase in NO2 columns of ~10% per year. McLinden et al. [GRL 2012] AQAST PI: R.R. DIckerson
AQAST Year 1 Highlight: Forecast support for DISCOVER-AQ NASA P-3 aircraft Statistical ozone forecasts provided to Maryland Department of Environment (MDE) during DISCOVER-AQ, summer 2011. Garner et al., in prep. AQAST PI: A.M. Thompson
AQAST Year 1 Highlight: Spatial variabilityof radiative forcing efficiency from anthropogenic emissions BC emissions Ammonia emissions Ozone forcing efficiency from NOx emissions Aerosol radiative forcing efficiency calculated with the GEOS-Chemadjoint, W m-2 / kg m-2 a-1 Radiative forcing efficiencies can vary spatially by a factor 4 across the US. AQAST PI: D.K.Henze Henze et al.[2012], Bowman and Henze[2012]
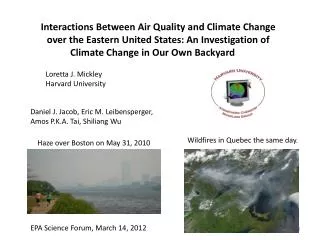
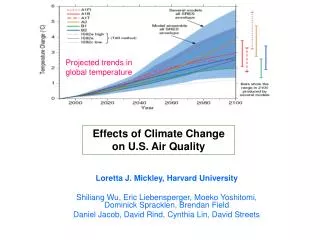
Racherla and Adams, 2006 Previously, models disagreed on the the magnitude and even sign of the impact of climate change on PM2.5. AQAST Year 1 Highlight: Quantifying the effect of climate change on PM2.5 air quality A2 mg m-3 Response of PM2.5 to 2000-2050 climate change. Pye et al., 2009 We need a simple tool that will allow AQ managers to readily calculate the climate penaltyfor PM2.5 air quality across a range of models and scenarios. A1 mg m-3 AQAST PI: L.J. Mickley
Principal component analysis shows that stagnation conditions elevate PM2.5 in Eastern US. August 25, 2012 PM2.5 We found that detrended interannual variability of PM2.5 in Midwest is correlated with cyclone period. Cyclone period Observed annual PM2.5 We examined 2010-2050 trends in cyclone period in the AR4 model ensemble.
Models disagree on the sign and magnitude of projected change in annual mean PM2.5, but some patterns emerge. 2000-2050 change in annual mean PM2.5 (µg m-3) Eastern US Northwest Midwest California Northeast Southeast Great Plains Pacific NW Interior NW Interior SW South-central • Likely responses: • Increase of ~0.1 µg m-3 in eastern US due to increased stagnation • Decrease of ~0.3 µg m-3 in Northwest due to more frequent maritime inflows
AQAST Year 1 Highlight: Quantifying the effect of climate change on PM2.5 air quality Effect of fires on PM2.5will likely have the largest impact in 2050s, especially regionally. Circulation Tai et al. 2012 East Northwest Temperature Heald et al, 2008; Pye et al., 2009; Tai et al., 2012a Southeast (OC) Southeast (nitrate) Vegetation Wu et al., 2012 Midwest + West Wildfires Spracklen et al., 2009; Yue et al., 2012 Northwest 2000-2050 change in annual mean PM2.5 (µg m-3) Tai et al. [2012 a,b] AQAST PI: L.J. Mickley PM2.5 air quality, 18 Sept 2012
Uncontrolled landfill liner fire within 5 miles of >150K people • 7.5 acres burned, May-June 2012 • 1.3 million shredded tires • Irritants + mutagens + SO2 + 5-80 µg/m3 PM2.5 • AQAST Nowcasting tool helped policymakers decide public health response & favorable conditions for fire intervention • WRF-Chem + GSI 3DVAR 72hr forecast assimilating NASA retrievals. • + AERMOD @ 100 m • + emissions factors from mobile monitoring by 3 groups • = New decision support toolkit for rapid public health response to urban toxic releases AQAST Year 1 Highlight: The Iowa Landfill Fire of 2012 AQAST PIs: Carmichael, Spak
AQAST Year 1 Highlight: Air quality workshops • Physical Atmosphere Advisory Group Spring 2012 Meeting (Atlanta, Apr 2012) • AQAST PI R.T. McNider • Examine the difficulties of AQ models have representing the physical atmosphere • Assess value of satellite data for addressing these difficulties • Using remote sensing data for air quality applications (U. Wisconsin, March 2012) • ARSET/LADCO with AQAST PIs T. Holloway, B. Pierce, G. Carmichael • New WHIPS software for regional model evaluation and analysis of OMI NO2 • Strategies for comparing satellite and model data
Communication Tools • Website: http://acmg.seas.harvard.edu/aqast • Newsletter: subscribe through website
Communication Tools NO2 columns 2005 • The AQAST Lenticular: • Tilt the card and see 3 images! • Low-tech but popular tool to advertise: • Success of US air quality regulations • Capability of satellites to detect pollution from space • AQAST mission and goals. NO2 columns 2010 Intensity of city lights OMI NO2 columns, x1015 molecules cm-2
Take-home messages • AQAST provides a bridge between NASA science resources and air quality management. • All AQAST projects are conducted in close partnership with air quality management partners. • AQAST is always seeking to increase its effectiveness in serving the needs of air quality managers. • If you have a specific problem for which you need information or assistance please contact team leader Daniel Jacob. Ozone garden at the Missouri Botanical Gardens
Climate change over US PM2.5 dependence on met variables The dependence of PM2.5 on meteorological variables is complex. Different components have different sensitivities. Model projections have uncertainties. Temperature ? Relative humidity ? Precipitation Stagnation ? Mixing depth AQ management tool CMIP3 archive of daily meteorology: 15 IPCC models AQ response to climate change Apply observed relationships between PM2.5 and met fields
An education and public outreach AQAST activity Ozone garden at the Missouri Botanical Gardens Planting the garden AQAST Year 1 Highlight: The Saint Louis Ozone Garden One of four explanatory signs Educating the public on ozone pollution effects on plants AQAST PI: J.G. Fishman