Download
1 / 39
390 likes | 576 Views
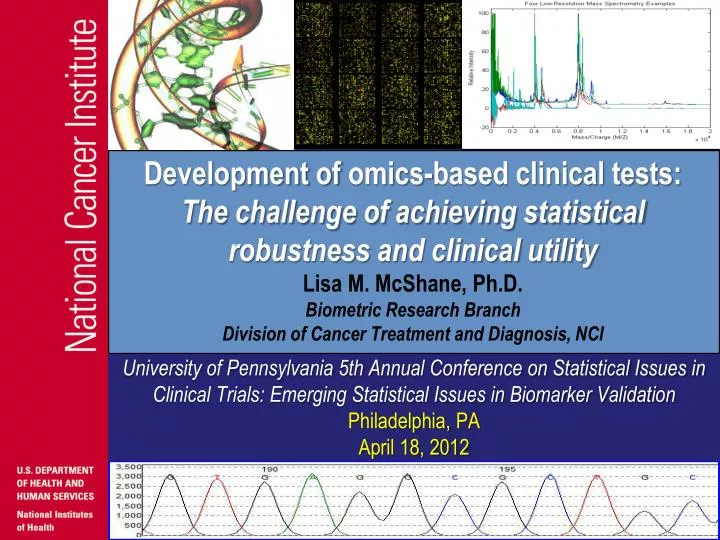
Development of omics -based clinical tests: The challenge of achieving statistical robustness and clinical utility Lisa M. McShane, Ph.D . Biometric Research Branch Division of Cancer Treatment and Diagnosis, NCI.

E N D
Development of omics-based clinical tests: The challenge of achieving statistical robustness and clinical utilityLisa M. McShane, Ph.D.Biometric Research BranchDivision of Cancer Treatment and Diagnosis, NCI University of Pennsylvania 5th Annual Conference on Statistical Issues in Clinical Trials: Emerging Statistical Issues in Biomarker Validation Philadelphia, PA April 18, 2012
Omics • “Omics” is a term encompassing multiple molecular disciplines, which involve the characterization of global sets of biological molecules such as DNAs, RNAs, proteins, and metabolites.” (IOM. 2012. Evolution of Translational Omics: Lessons Learned and the Path Forward. Washington, DC: The National Academies Press.) • Genomics • Transcriptomics • Proteomics • Metabolomics • Epigenomics 2
Example Omic Assays SKY analysis of AML cells Mutation sequence surveyor trace Illumina SNP bead array cDNA expression microarray MALDI-TOF proteomic spectrum Affymetrix expression GeneChip
GOAL: Omic “signature” Clinical test Quantify pattern • Pre-process • Input to classifier or calculate risk score Predict clinical outcome or characteristic ER+, N0 Inform clinical decision Paik et al. 2006, J ClinOncol Oncotype DX 21-gene RS, prognostic, predictive? Buyse et al. 2006, J Natl Cancer Inst Mammaprint (70-gene), prognostic
Definitions • Analytical validity • Does the test accurately and reproducibly measure the analyte or characteristic? • Clinical/biological validity • Does the test identify a biologic difference (e.g., “pos” vs. “neg”) that may or may not be clinically useful? • Clinical utility • Do results of the test lead to a clinical decision that has been shown with high level of evidence to improve outcomes? Teutsch et al. 2009, Genet Med Simon et al. 2009, J Natl Cancer Inst 5
Potential roles for omics-based tests in medicine • Confirmation • Staging • Subtyping Diagnosis • Risk • Screening • Early detection • Prognostic • Predictive • Early response or futility • Toxicity monitoring • Early endpoint • Recurrenceor progression monitoring FOCUS: Initial therapy selection
Overview • Distinguishing prognostic vs. predictive • What makes a test “clinically useful” • Pitfalls in development of prognostic and predictive tests from high-dimensional omic data • Challenges in evaluation of tests on retrospective specimen & data sets • Challenges for prospective evaluation 7
Prognostic test • PROGNOSTIC:Measurement associated with clinical outcome in absence of therapy (natural course) or with standard therapy all patients are likely to receive • Clinical use: Identify patients having highly favorable outcome in absence of (additional) therapy or extremely poor outcome regardless of (additional) therapy • Research use: Disease biology, identify drug targets, stratification factor in clinical trials 8
Predictive test • PREDICTIVE: Measurement associated with benefit or lack of benefit (or potentially even harm) from a particular therapy relative to other available therapy • Alternate terms: • Treatment stratification biomarker • Treatment effect modifier • Treatment-guiding biomarker • Treatment-selection biomarker • Examples: • Endocrine therapies for breast cancer will benefit only patients whose tumors express hormone receptors • SNPs in the drug metabolizing gene CYP2D6 may confer high risk of serious toxicities from narcotic analgesics • Ideally should be developed synchronously with new therapeutics 9
When is a prognostic test clinically useful? • Is the prognostic information sufficiently strong to influence clinical decisions (absolute risk important)? • Does the biomarker provide information beyond standard prognostic factors? Good prognosis group (M-) may forego additional therapy Is this prognostic information helpful? Hazard ratio = .56 Hazard ratio = .18
Prognostic vs. predictive distinction:Importance of control groups No survival benefit from new treatment Prognostic but not predictive New treatment for all or for M+ only?* Prognostic and predictive 11 (*Different considerations might apply for Standard Treatment New Treatment)
When is a predictive test clinically useful? Treatment-by-biomarker interaction: Is it sufficient? Prognostic and predictive; New treatment for all?* Prognostic and predictive; New treatment for M+ only • Qualitative interaction • Std Trt better for M (HR= 1.36) • New Trt better for M+ (HR+= 0.63) • Interaction = 0.63/1.36 = 0.47 • Quantitative interaction • New Trt better for M (HR = 0.44) • New Trt better for M+ (HR+ = 0.63) • Interaction = 0.63/0.44 = 1.45 Interaction = HR+/HR where HR=New/Std 12 (*Different considerations might apply for Standard Treatment New Treatment)
Pitfalls in developing prognostic and predictive tests from omic data • Most published papers on omic signatures derived from high-dimensional omic data represent biological explorations or computational exercises in search of statistically significant findings • Some biological insights gained, BUT . . . • Few signatures have advanced to the point of having established clinical utility • Unfocused clinical context (“convenience” specimens) • Clinical vs. statistical significance 13
Pitfalls in developing prognostic and predictive tests from omic data • Many published papers on omic signatures have generated spurious findings or used faulty model development or validation strategies • Poor data quality (specimens or assay) • Poor experimental design (e.g. confounding with specimen handling or assay batches) • Multiple testing & model overfitting • Failure to conduct rigorous, independent validation • Blinding & separation of training and test sets • Biases introduced by non-randomized treatment • Pre-specified analyses with appropriate type I error control • Lack of statistical power 14
Development of an omic signature Screen out unsuitable data or specimens Generate raw data from selected specimens Training sets Raw data pre-processing: normalization, calibration, summary measures Model development Identify features (e.g., genes, proteins) relevant to a clinical or pathological distinction Apply algorithm to develop a classifier or score; INTERNAL VALIDATION EXTERNAL VALIDATION on INDEPENDENT set of specimens/data 15
Artifacts • Omic assays can be exquisitely sensitive to detect subtle biological differences • BUT, also exquisitely sensitive to • Specimen processing and handling differences • Assay variation • Different technical protocol • Between-lab • Within-lab, between-batch, between-technician • BE VIGILANT • Check for artifacts & confounding • Control for in experimental design if possible 16
Assay batch effects: Gene expression microarrays Density estimates of PM probe intensities (Affymetrix CEL files) for 96 NSCLC specimens Red = batch 1 Blue = batch 2 Purple & Green = outliers? PCA plots after RMA pre-processing with and without outlier CEL files Normalized data may depend on other arrays normalized in the same set (Figure 1 from Owzar et al. 2008, Clin Cancer Res using data from Beer et al. 2002, Nat Med ) 17
Assay batch effects: Sequence data Batch effects for 2nd generation sequence data from the 1000 Genomes Project. Standardized coverage data represented. Same facility, same platform. Horizontal lines divide by date. 18 Figure 2 from Leek et al. 2010, Nature Rev Genet
Development and validation of the signature model • Selection of informative features • Reduce noise • Reduce dimension • Building a classifier (predictor) model • Link signature variations to clinical outcome or biological characteristic • Check for overfitting of the signature model • Internal validation • External assessment of model performance 19
Feature selection & data reduction • Identify “informative” features (e.g., distinguish favorable vs. unfavorable outcome) • Control false positives • Potentially many distinct, equally informative sets • Unsupervised dimension reduction • Create “super” features (e.g., “super genes”, pathways) • Example emprical methods: • Principal components analysis (PCA), or more generally multidimensional scaling • Clustering to produce cluster level summary features • Supervised dimension reduction • Feature selection followed by dimension reduction • Example: Supervised principal components 20
Building the molecular signature model • Construct classifier function or risk score • Linear Predictors (e.g., LDA, SVM): L(x) = w1x1 + w2x2 + . . . + wfxf to which cutpoint is often applied • Distance-based (e.g., nearest neighbor, nearest centroid) • Numerous other methods: • Decision trees • Random forests • Completely stochastic or Bayesian model averaging • No “best” method for all problems 21
Dangers of model overfitting • Overfitting occurs when a statistical model describes random error or noise instead of the underlying relationship • Model is excessively complex, such as having too many parameters relative to the number of observations • Overfit model will generally have poor predictive performance, as it can exaggerate minor fluctuations in the data (Source: http://en.wikipedia.org/wiki/Overfitting) • In high dimensions, true models are always complex and data are always sparse • VALIDATION OF MODEL PERFORMANCE IS ESSENTIAL 22
Model validation • RESUBSTITUTION (plug in training data) estimates of model performance are highly biased and COMPLETELY USELESS in high-dimensional data setting • INTERNAL:Within-sample validation • Cross-validation • (Leave-one-out, split-sample, k-fold, etc.) • Bootstrap and other resampling methods • Method comparisons: Molinaro et al. 2005, Bioinformatics • EXTERNAL:Independent-sample validation 23
Simulation of prognostic model resubstitutionmethod • (Subramanian and Simon 2010, J Natl Cancer Inst – lung cancer prognostic signatures) • Survival data on 129 patients from Bild et al. 2006, Nature • Expression values for 5000 genes generated randomly from N(0, I5000) for each patient • Data divided randomly into training and validation sets • Prognostic model developed from training set and used to classify patients in both training and validation sets 24
Prognostic model resubstitution example “A 15-gene signature separated OBS patients into high-risk and low-risk subgroups with significantly different survival (hazard ratio [HR], 15.02; 95% CI, 5.12 to 44.04; P <.001; stage I HR, 13.31; P <.001; stage II HR, 13.47; P <.001).” (Zhu et al. 2010, J ClinOncol) All stages, OBS, n=62 HR=15.02, p<.001 95% CI=(5.12,44.04) Stage IB, OBS, n=34 HR=13.32, p<.001 95% CI=(2.86,62.11) Stage II, OBS, n=28 HR=13.47, p<.001 95% CI=(3.00,60.43) Figure 1 legend: “Disease-specific survival outcome based on the 15-gene signature in the JBR.10 training set.” 25
Independent validations (?) of 15-gene prognostic score “The prognostic effect was verified in the same 62 OBS patients where gene expression was assessed by qPCR. Furthermore, it was validated consistently in four separate microarray data sets (total 356 stage IB to II patients without adjuvant treatment) and additional JBR.10 OBS patients by qPCR (n=19).” DCC: HR=2.36, p=.026 Duke: HR=2.01, p=.08 UM: HR=3.18, p=.006 NKI: HR=2.02, p=.033 RT-qPCR RT-qPCR 1/9 events What happened to HR=15.02? JBR.10 OBS: HR=2.02, p=.033 JBR.10 ADD: HR=2.02, p=.033 Is this still clinically useful? (years) (years) 26
Partial resubstitution:Combining training and test sets Failure to maintain separation of training and test sets Lung Metagene Score Predictor Over half (39/68) of the cases used to generate the figure were from the training set used to develop the model, and 39/89 of those training cases were Stage IA. (Figure 5A from Potti et al. 2006, N Engl J Med) 27
Internal validation: Leave-one-out cross-validation (LOOCV) Specimens 1, 2, . . ., j-1, j+1, . . ., N Specimen j Set aside Build classifier (feature selection, model parameter estimation, etc.) “Plug-in” Specimen j and record predicted class Repeat for each j ALL steps, including feature selection, must be included in the cross-validation loop 28
Simulation of cross-validation approaches • 100specimens, 1000 simulations • 6000 markers measured on each specimen • Marker measurements generated as independent Gaussian white noise (i.i.d. N(0,1)) • Artificially separate specimens into two groups (first 50, last 50) so there is NO true relation between markers and group • Build predictor of class • Select markers univariate t-test, =0.001 • Linear discriminant analysis (LDA) • TRUE PREDICTION ACCURACY (and misclassification error rate) SHOULD BE 50% 29
Importance of correct cross-validation True accuracy = 50% obtained by “LOOCV Correct” “Resubstitution” is the naïve method of testing model performance by “plugging in” the exact same data as were used to build the model “LOOCV Wrong” does not re-select features at each iteration of the cross-validation, and it is nearly as biased as the naïve resubstitution estimate 30
Incorrect validation: Is bias only a problem with a verylarge number of markers? M=10 Mean % Errors: Correct: 52% Wrong: 44% Resub: 42% • 100specimens, 1000 simulations • M = 10, 50, or 100 markers measured on each specimen • Markersi.i.d. N(01) • Randomly separate specimens into two groups (first 50, last 50) so there is NO true relation between markers and group • Build predictor of class • Select markers by univariate t-test, =0.1 • Linear discriminant analysis (LDA) • TRUE PREDICTION ACCURACY (and misclassification error rate) SHOULD BE 50% M=50 Mean % Errors: Correct: 51% Wrong: 37% Resub: 32% M=100 Mean % Errors: Correct: 51% Wrong: 31% Resub: 24% Simulations performed by E. Polley 31
Limitations of internal validation • Frequently performed incorrectly (e.g., not including feature selection) • Cross-validated predictions can be tested in models using typical statistical inference procedures • Not independent variables • Conventional testing levels and CI widths not correct (Lusa et al. 2007, Stat in Med; Jiang et al. 2008, Stat ApplGen Mol Biol) • Large variance in estimated accuracy and effects • Doesn’t protect against biases due to selective inclusion/exclusion of samples • Doesn’t protect against built-in biases (e.g., lab batch, variable specimen handling) EXTERNAL VALIDATION IS ESSENTIAL!!! 32
Assessment of predictive tests: Dangers of resubstitution Is resubstitution acceptable when model was fit using the control (OBS) arm only? NO! (Fig. 3, Zhu et al. 2010, J ClinOncol) High risk, microarray Low risk, microarray High risk, RT-qPCR Low risk, RT-qPCR 33
Assessment of predictive tests: Dangers of nonrandomized treatment, different cohorts Figure 1. Genomic Decision Algorithm to Predict Sensitivity of Invasive Breast Cancer to Adjuvant Chemotherapy (CT) or Chemoendocrine Therapy (CT+ HT) (Hatzis et al. 2011, JAMA) eFigure 6A. Validation Cohort #2 Figure 2. Validation Cohort #1 Claim: Test is predictive and not prognostic P=.002 (Fig 2) vs. P=.096 (eFig 6A) 35% N, 65% N+ 62% ER+ AT HT if ER+ 100% N ER+ & ER (%?) No HT & no CT A = anthracycline T = Taxane 34
Prospective trials to evaluate clinical utility of omic tests • Comparison of randomized designs (Sargent et al. 2005, J ClinOncol; Freidlin et al. 2010, J Natl Cancer Inst; Clark and McShane 2011, Stat in Biopharm Res) • Enrichment design • Completely randomized design • Randomized block design • Biomarker-strategy design • Adaptive designs • Challenges • Big, long, and expensive • Inadequate enforcement of regulatory requirements • Test may become available before trial completes accrual • Difficulties with blinding & compliance 35
Quiz • Detection of model overfitting and biased study designs requires in-depth knowledge of complex statistical approaches to the analysis of high-dimensional omic data. • TRUE or FALSE • Poor model development practices have few adverse consequences because the models will eventually be tested in rigorously designed clinical studies. • TRUE or FALSE 36
Summary remarks • Need earlier and more intense focus on clinical utility • Need rigor in omics-based test development and study design • EXTERNAL VALIDATION is essential • Need more complete and transparent reporting of omics studies • REMARK guidelines (McShane et al. 2005, J Natl Cancer Inst) • REMARK Explanation & Elaboration (Altman et al. 2012, BMC Med and PLoS Med) • Availability of data and computer code? • Need multi-disciplinary collaborative teams with ALL relevant expertise included 37
Acknowledgments • NCI Cancer Diagnosis Program Barbara Conley (Director), Tracy Lively • NCI Biometric Research Branch Richard Simon (Chief), Ed Korn, Boris Freidlin, Eric Polley, Mei Polley • Institute of Medicine Committee for Review of Omics-Based Tests for Predicting Patient Outcomes in Clinical Trials (http://iom.edu/Activities/Research/OmicsBasedTests.aspx) 38
References for images 1. SKY AML image http://www.nature.com/scitable/topicpage/human-chromosome-translocations-and-cancer-23487 2. Mutation sequence surveyor trace (public domain) http://upload.wikimedia.org/wikipedia/commons/8/89/Mutation_Surveyor_Trace.jpg 3. Illumina SNP bead array https://www.sanger.ac.uk/Teams/Team67/ 4. cDNA expression microarray image (public domain) http://en.wikipedia.org/wiki/File:Microarray2.gif 5. AffyGeneChip expression array Source unknown 6. MALDI-TOF proteomic spectrum Hodgkinson et al. (Cancer Letters, 2010) 39