Download
1 / 23
230 likes | 330 Views
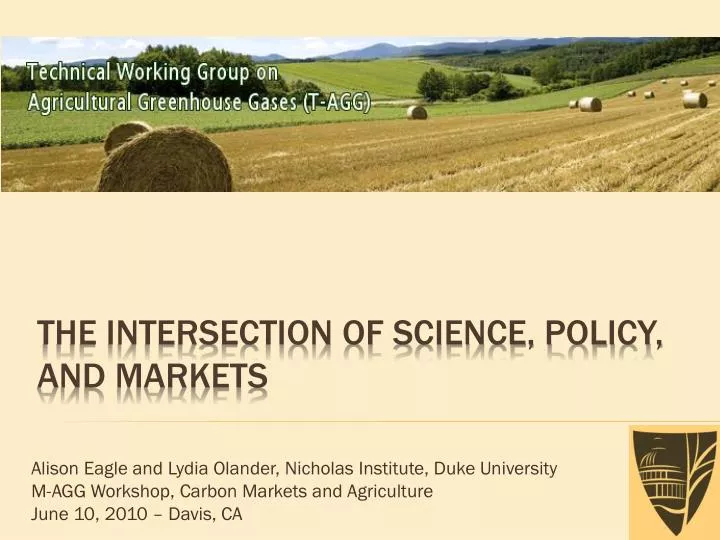
Alison Eagle and Lydia Olander, Nicholas Institute, Duke University M-AGG Workshop, Carbon Markets and Agriculture June 10, 2010 – Davis, CA. The intersection of science, policy, and markets .

E N D
Alison Eagle and Lydia Olander, Nicholas Institute, Duke University M-AGG Workshop, Carbon Markets and Agriculture June 10, 2010 – Davis, CA The intersection of science, policy, and markets
“Agricultural land management practices in the United States have the technical potential to contribute about 230 Mt CO2e/yr of GHG mitigation by 2030 “ -Smith et al., 2008
…private or voluntary GHG market …cap & trade legislation …incentive program to mitigate GHGs …corporate-driven supply chain requirements …low carbon biofuels All require technical and background scientific information to ensure environmental progress is achieved and farmers are fairly compensated Information needs are context-specific What if.....?
Lay the scientific and analytical foundation necessary for building a suite of methodologies for high-quality greenhouse gas (GHG) mitigation for the agricultural sector T-AGG Purpose
Advisory board and Science advisors • researchers, government agencies, agriculture & agri-business, NGOs • Many years of experience in carbon & other GHGs • Broader network • Email list and website • Information gathering meeting, Nov ’09, Expert meeting Apr ‘10 • Frequent interaction with protocol developers, policy makers and others working in this space • Open review process and outreach meetings • C-AGG/M-AGG (policy; market mechanisms) Collaborative and transparent
Review of agricultural GHG mitigation opportunities in the U.S. Side-by-side assessment of biophysical and economic potential; barriers and co-effects Produce technical reports with executive summaries for stakeholders and decision makers (Synthesis, Carbon, N2O) Outreach and engagement Similar process for international opportunities T-AGG Process Gather expert and user input
Over 800 papers (mostly peer reviewed) Soil carbon, N20 and CH4 Upstream and process emissions Compared and enhanced with model results (Century and DayCENT) Showing range of values Scaled up to national using weighted averages Separate review of co-effects, barriers… Methods: literature
Biophysical GHG Mitigation Potential Note: negative means storage or emission reduction
Biophysical GHG Mitigation Potential Note: negative means storage or emission reduction
Quantify valid comparisons in research Highlights where research is missing Methods: Data Availability and gaps
Usually use area metrics CO2e/acre • Intensity metrics based on productivity/output • CO2e/tons of crop produced (yield) • Positives • Encourages increasing efficiency aligning with food security • Expand ag practices that would count for mitigation programs • Internalizing the yield impacts on the broader system (good and bad leakage) • Concerns • Intensity approach, allows overall emissions to continue to increase • Positive(good) leakage is an imperfect approach adding uncertainty regarding overall environmental impact • Financial additionality? Would farmers do it anyway if it increases yield? • Yield volatility adds uncertainty to crediting Intensity Based metrics http://www.nicholasinstitute.duke.edu/t-agg
Land use competition & implementation costs – not all practices can achieve full biophysical potential Responses to carbon prices – efficiency gained when least costly mitigation practice is first target Full GHG accounting – assumes that all sources and sinks are counted in the market (somehow) Modeling for economic response
Net GHG Mitigation by Source (Mt CO2e) Source: FASOMGHG economic model Note: negative means storage or emission reduction
Regional Variation: For C and N2O Figure 2. Representative map of FASOMGHG regions and sub-regions
What emissions or sinks are counted? • Depends on the policy or market context • Measurement, additionality and baseline • Field Sampling alone (difficult) • Modeling with site data/field sampling (preferable) • Agricultural Systems/ mix of practices • Accounting for multiple practices in combination • Verification and monitoring • Practice based with variable level of detail depending on measurement choice • Leakage • Intensity metrics • Modeling/look up tables • Reversals • Understand GHG impacts, tools to evaluate risks Implementation and Accounting
Buyer wants to ensure there is a difference • Protect against Type I error (false positive) • Type II error (false negative) is more important to seller (farmer) • Can need 2 to 3 times more samples to have confidence (95%) that a real difference is detected Sampling and measurement Minimum # of samples needed to detect difference (95% confidence)
Biogeochemical models Current Practices (crop, rotation, tillage…) Scale models to address variability Land use history
Working with wide range of research experts and modelers to develop detailed information • Draft reports – Synthesis this summer and C and N2O this fall • Coordinating meetings for feedback on the reports • Initiating international assessments Next Steps
Thank you Website and email list http://www.nicholasinstitute.duke.edu/t-agg
Baker, J.S., B.A. McCarl, B.C. Murray, S.K. Rose, R.J. Alig, D.M. Adams, G. Latta, R. Beach and A. Daigneault (2010). "Net farm income and land use under a U.S. greenhouse gas cap and trade." Policy Issues, PI7 - April 2010: 1-5 Output based paper coming soon – with examples Relevant references
Significant Co-benefits? May consider activity with lower GHG potential if it provides other social, economic or environmental co-benefits
Number of samples needed to detect SOC change, 0-30 cm depth [7–14 g carbon/kg, 1.4 g/cm3 (~140 t C/ha)] VandenBygaart, A.J., E.G. Gregorich, D.A. Angers and B.G. McConkey (2007). "Assessment of the lateral and vertical variability of soil organic carbon." Canadian Journal of Soil Science 87(4): 433–44.