Download
1 / 12
120 likes | 256 Views
Local Severe Weather Climatologies for WSR-88D Radar Areas across the United States. John A. Hart NOAA/NWS/NCEP Storm Prediction Center Norman, Oklahoma. Introduction. Developed a climatology of severe weather reports (1980-2004) Useful due to equal areas of radar coverage regions.

E N D
Local Severe Weather Climatologies for WSR-88D Radar Areas across the United States John A. Hart NOAA/NWS/NCEP Storm Prediction Center Norman, Oklahoma
Introduction • Developed a climatology of severe weather reports (1980-2004) • Useful due to equal areas of radar coverage regions. • Allows easy comparison between geographical regions.
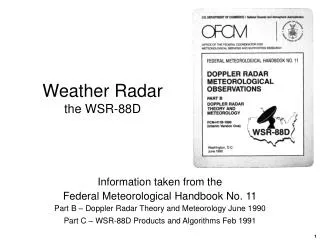
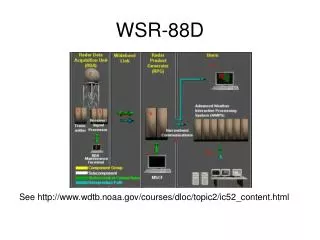
Methodology • Used the NWS/SPC severe weather database • Compiled reports within each WSR-88D radar coverage region for the period of record • Created graphs, tables, figures • Computed tornado threat probabilities based on tornado path width, length, and intensity ratings • Objectively determined primary severe weather season for each region. • NOTE: No additional quality-control. Data is plotted and tabulated directly from SPC database*. * Schaefer, J. T. and R. Edwards, 1999: The SPC Tornado/Severe Thunderstorm Database. Preprints, 11th Conf. On Applied Climatology, Dallas, AMS (Boston), 215-220.
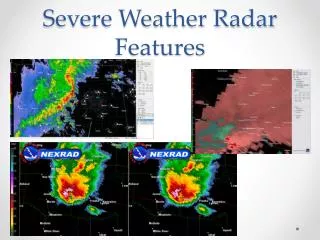
Geographical Distributions25 years of data • Factors for distribution include: • Meteorological factors • Population • Road networks • Spotter networks • Etc. Greenville-Spartanburg, SC Little Rock, Arkansas Milwaukee, Wisconsin Denver, Colorado
March 23rd July 27th Severe Weather SeasonsDefined by objective methods Max 10.5 on 06/09 Average of 2.9 for season • Determine average daily number of severe weather reports • - 7-day running average of all reports (hail, wind, torn) • Any day with value above average meets threshold for season. • Short duration minima are ignored. (5-days or less)
ComparisonsDaily Occurrences & Seasons • St. Louis, Missouri • Season from Mar 29th – Aug 6th • Max of 5.1 on May 28th • Atlanta, Georgia • Season Mar 14th – Aug 4th • Max of 6.7 on May 2nd • Denver, Colorado • Season from Apr 28th – Sep 4th • Max of 4.3 on June 5th • Phoenix, Arizona • Season Jun 28st – Sep 19th ? • Max of 1.2 on Aug 14th
ComparisonsAnnual Occurrences Kansas City, Missouri - Recent increase in hail Pittsburgh, Pennsylvania - Mostly wind reports Hastings, Nebraska - Mostly hail reports Shreveport, Louisiana - Decreasing trend last 10 years
ComparisonsHourly Occurrences Houston, Texas - Severe threat all night • Tallahassee, Florida • Hail and Wind are diurnal • Tornadoes are not • Albany, New York • Rarely severe between 05-14z • - Max threat 21z • Glasgow, Montana • Wind threat lags hail threat • Max threat 02z.
Tornado Strike Probabilities-Return Intervals for any point * Point Probabilities
Rankings – Top 10 Annual Tornado Days Sig. Severe Reports Annual Severe Days Sig. Tornado Reports Sig. Tornado Threat (Annual Avg. Prob.) All Severe Reports
Conclusions • Hopefully useful and informative reference for severe weather distributions across the USA. • Future plan to extend work to county-based CWA areas. • http://www.spc.noaa.gov/climo