Download
1 / 26
260 likes | 399 Views
The Seismic Hazard from Major Earthquakes in the Central and Eastern U.S. Martitia P. Tuttle M.P. Tuttle and Associates Georgetown, ME. John E. Ebel Weston Observatory Department of Geology and Geophysics Boston College. The questions being posed here:

E N D
The Seismic Hazard from Major Earthquakes in the Central and Eastern U.S. Martitia P. Tuttle M.P. Tuttle and Associates Georgetown, ME John E. Ebel Weston Observatory Department of Geology and Geophysics Boston College
The questions being posed here: What is the probability of a major (M>=7) earthquake in the Central and Eastern US (CEUS)? Where can a major earthquake occur in the CEUS?
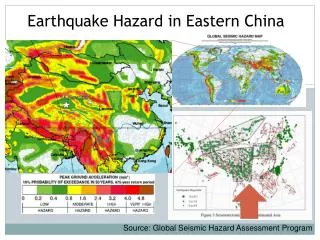
Probabilistic Seismic Hazard of the CEUS This map depicts “earthquake hazard by showing, by contour values, the earthquake ground motions that have a common given probability of being exceeded in 50 years.” (USGS web site)
The USGS Probabilistic Seismic Hazard Maps • “The ground motions being considered at a given location are those from all future possible earthquake magnitudes at all possible distances from that location.” (USGS web site) • Probabilistic seismic hazard calculations assume that earthquakes occur randomly in time with known (assumed) spatialand magnitude distributions. • Smaller earthquakes are more probable than large earthquakes, so probabilistic seismic hazard maps primarily reflect the hazard from smaller and less potentially damaging earthquakes.
Least probable but most damaging event (M7.5). M = 7.5 M = 7.0 M = 6.5 M = 6.0 M = 5.5 M = 5.0 Most probable but least damaging event (M5). Potential Economic Losses from Large Earthquakes Small magnitude earthquakes have only a local effect, while large magnitude earthquakes can affect a large area. Rasmusson, 2003
Most probable but least damaging events. Least probable but most damaging events. Potential Economic Losses from Large Earthquakes (Cont.) Small magnitude earthquakes have only a minor economic consequences, while large magnitude earthquakes can major economic consequences. Probabilities of losses in 50 years. Rasmusson, 2003
Major Earthquakes and Seismic Hazard in the CEUS • For seismic hazard calculations in the CEUS, we need to know how often and where strong (i.e., M>=7.0) earthquakes can occur in eastern North America. We know strong earthquakes can occur (i.e., 1811-1812, 1886, 1663, 1929), but estimating their rate of occurrence and likely future sites is highly uncertain.
Current Methods of Estimating the Rates of Strong Earthquakes • For the CEUS, the rates of strong earthquakes are estimated currently using: • -- Extrapolations from the rates of smaller seismicity using Gutenberg-Richter (log N versus M) curves • -- Geologic data on the history of past strong earthquakes (paleoseismological investigations)
1811-1812 (1 event) & 1886 (Recurrence relations from Nishenko and Bollinger, 1990) Problems with the Current Approach • In the CEUS, more strong earthquakes have been observed historically than expected from log N versus M analyses
1663, 1811-1812 (1 event), 1886 & 1929 (Recurrence relations from Nishenko and Bollinger, 1990) • For Eastern North America, the same problem is encountered
The Characteristic Earthquake Model and Major Earthquake Recurrence Characteristic Earthquakes Log N Routine Seismicity M • The “characteristic earthquake” model also implies that the rate of large earthquakes cannot be extrapolated from log N versus M curves of smaller earthquakes Large earthquakes may occur more often than expected from the routine smaller seismicity
New Madrid as an Example of the Problem • Evidence from New Madrid illustrates the difficulty of estimating the rates of large magnitude events even in a well-studied area: • -- Studies of liquefaction and other earthquake induced features indicate that there have been as many as 4 M7+ earthquake episodes at New Madrid in the last 2000 years (characteristic(?) strong earthquakes more frequent than expected from log N versus M data) • -- Geodetic data from GPS observations show no resolvable neotectonic deformation, suggesting that the past rate of strong earthquakes at New Madrid may not be sustained there in the future
Small Earthquake Activity as Aftershocks of Earlier Major Earthquakes • The “paleoseismicity model” of Ebel et al. (2000) postulates that many or even most of the small, annual seismicity of the CEUS is aftershock activity of large earthquakes from long ago. This model has implications for the recurrence times of strong earthquakes in the CEUS.
The Dilemma Posed by the “Paleoseismicity Model” • If many or even most of the small, annual earthquakes in the CEUS are aftershocks of large earthquakes from long ago, then it may not be possible to extrapolate the rates of occurrence of strong earthquakes from the smaller earthquake activity of the region. • How, then, can the rates of large (say M>=7) earthquakes be estimated?
“Paleoseismicity Model” Tutorial Measurably elevated rates of aftershock activity may persist hundreds or even thousands of years after a large earthquake. M 7.0 Mainshock The magnitude of a paleoseismic main shock can be estimated from the length of the current seismic (i.e., aftershock) zone using relations such as those by Wells and Coppersmith (1994).
Implications of the Paleoseismicity Model for Seismic Hazard Analyses • Most or all earthquakes below some magnitude (5.5? or 6.0?) are aftershocks of past strong events. The rates of these shocks can be extrapolated accurately from Gutenberg-Richter recurrence relations. • The rates of strong earthquakes (M>=7.0) cannot be extrapolated from the rates of smaller magnitude earthquakes.
Estimating the Rate of M>=7.0 Events with the Paleoseismicity Model • Try looking at the number of active spatial earthquake “clusters” and estimate the magnitude and time of each possible past strong earthquake • Get an estimate of the rate of past strong earthquakes from the total number of active “clusters” that may represent strong earthquakes within some specific time window (i.e., 1000 years)
Spatial Earthquake “Clusters” in the CEUS The green arrows show the locations of the 1663 Charlevoix and 1811-1812 New Madrid earthquakes. The seismicity rates in these areas can be used to constrain the aftershock activity rate parameters in Omori’s Law. Contours show average rates of M=0 earthquakes in 60 years (Frankel, 1995).
Possible Major Paleoearthquake Sites in the CEUS The red arrows show CEUS locations where the average rate of M=0 events in 60 years exceeds 8.0. These are suspected sites of past large earthquakes. (Map from Frankel, 1995)
Expected Number of Strong EQs Nishenko & Bollinger (1990) Relation 1 3.0 5.7 Nishenko & Bollinger (1990) Relation 2 1.7 3.1 Estimated Rates of Past Strong Earthquakes in the CEUS If all the paleoseismic main shocks have M=7.0 Rate M=0 EQs in 60 Years 16+ 8+ Time Window (years) 1118 2124 Observed # of “Clusters” 8 15 (Assuming average values for the a, b, and p parameters in Omori’s Law)
Observed # of “Clusters”* Expected # ofStrong EQs Rel. 1 6.1 13.1 Rel. 2 3.8 7.2 Rel. 1 3.0 5.7 Rel. 2 1.7 3.1 * The number of clusters has been corrected for large events before the time window using the G-R distribution If the paleoseismic main shocks have a Gutenberg-Richter Distribution between M=7.0 and M=7.5 (Using Nishenko and Bollinger (1990) CEUS Relations) Rate M=0 EQs in 60 Years 16+ 8+ Time Window (years) 1118 2124 (Assuming average values for the a, b, and p parameters in Omori’s Law)
Results of the Analysis • If the spatial “clusters” represent the locations of M>=7.0 earthquakes during the past 1,000-2,000 years, then the rate of strong earthquakes in the CEUS has been greater than extrapolations from Gutenberg-Richter recurrence relations would suggest. • If some past strong earthquakes were followed by less active aftershock sequences, then the number of spatial clusters identified here may reflect a lower bound on the number of M>=7.0 events in the past 1,000-2,000 years.
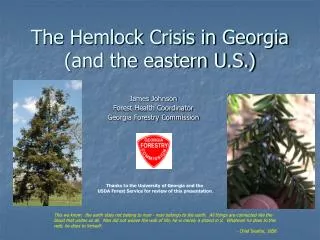
Geologic Evidence of Major Prehistoric Earthquakes • Geologic studies at a number of sites in the CEUS have demonstrated the occurrences of major earthquakes during the past several thousand years: e.g., the Meers Fault (Oklahoma), the Wabash Valley (Indiana), coastal New Hampshire (possible tsunami deposit), northern South Carolina. These discoveries suggest that there are potentially many places in the CEUS where M>=7 earthquakes could take place.
Conclusions • The “paleoseismicity model” suggests that the seismicity of M<=6 in the CEUS is predominantly aftershocks of past strong earthquakes. Seismicity rates computed from Gutenberg-Richter recurrence relations for M<=6 can be used to accurately compute the seismic hazard from earthquakes of this size. Thus, the shorter term seismic hazard values for the CEUS, which reflect primarily the ground motions from lower magnitude events, are relatively unbiased estimates of the hazard.
Conclusions (cont.) • Under the “paleoseismicity model”, seismicity rates for M>=7.0 events cannot be computed from Gutenberg-Richter recurrence relations of the smaller magnitude seismicity. Seismicity clusters in the CEUS suggest that the rate of past M>=7.0 events may be greater than G-R recurrence relations indicate. Thus, the longer term seismic hazard values in the CEUS, which reflect primarily the ground motions from higher magnitude events, may under-represent the seismic hazard.