Download
1 / 15
210 likes | 314 Views
Represent Relations and Functions. Relation. A relation is a mapping , or pairing , of input values with output values. The set of input values in the domain . The set of output values is the range. Representing Relations. A relation can be represented in the following ways:

E N D
Relation • A relation is a mapping, or pairing , of input values with output values. • The set of input values in the domain. • The set of output values is the range.
Representing Relations A relation can be represented in the following ways: • Ordered pairs • Table • Graph • Mapping Diagram
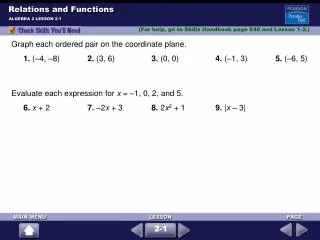
Ordered Pairs (-2, 2), (-2, -2), (0, 1), (3,1) Domain (the x values): {-2, 0, 3} Range (the y values): {-2, 1, 2}
Table Domain: {-4, -2, 1, 4} Range: {2, 6, 7}
Graph Domain: {-2, -1, 2, 3} Range: {-3, -2, 1, 3}
Mapping Domain: {-2, -1, 1, 2, 3} Range: {-3, -2, 1, 3}
Is the relation a function? • A relation is a function if each input has exactly one output… “the x’s can’t repeat”
Function?? Function Not a Function
Vertical Line Test • A relation is a function if and only if no vertical line intersects the graph of the relation at more then one point. FunctionNot a Function
Equations in Two Variables • An equation in two variables is an equation such as y = 3x -5 • “x “ is the input variable and is called the independent variable. It represents the independent quantity. • “y” is the output variable and is called the dependent variable. It represents the dependent quantity. “y depends on x”
Solution • An ordered pair (x, y) is a solution of an equation in two variables if substituting x and y in the equation produces a true statement. Ex: (2, 1) is a solution to y = 3x – 5 because 1 = 3(2) – 5 • The graph of an equation in two variables is the set of all points (x, y) that represent solutions of the equation.
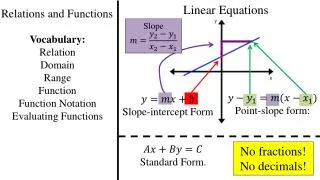
Linear Functions • A linear function can be written in the form y = mx + b • The graph of a linear function is a line • y = mx + b ~ x-y notation • f(x) = mx + b~ function notation (‘f of x” or “the value of f at x”) Ex: f(x) = 5x + 8 f(-4) = 5(-4) + 8 = -12 The value of the function at x = -4 is 12
Discrete and Continuous Functions • The graph of a continuous function is “unbroken” • The graph of a discrete function consists of separate points.
Slope Watch and listen to the following links: Introduction to slope Parallel and Perpendicular Lines