Download
1 / 16
160 likes | 271 Views
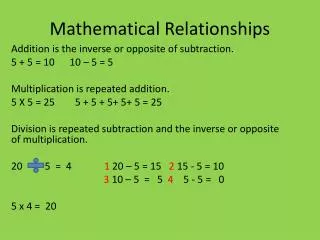
Visualizing Mathematical Relationships Through Tape Diagrams. Common Core Leadership in Mathematics (CCLM) Thursday June 28, 2012.

E N D
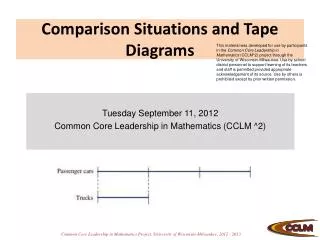
Visualizing Mathematical Relationships Through Tape Diagrams Common Core Leadership in Mathematics (CCLM)Thursday June 28, 2012 This material was developed for use by the project staff and participants in the Common Core Leadership in Mathematics (CCLM^2) project through the University of Wisconsin-Milwaukee. Use by school district personnel to support learning of its teachers and staff is permitted provided appropriate acknowledgement of its source. Use by others is prohibited except by prior written permission.
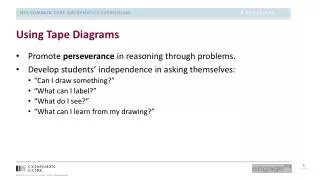
Homework Discussion Share your reflection on your current understanding of tape diagrams and how they contribute to the development of SMP2 in students’ thinking.
Learning Intentions We are learning to… • Make a meaningful transition from concrete representations to abstract representation. • Use tape diagrams as an effective tool to support quantitative reasoning. We will be successful when we can… • Use discrete and continuous models to illustrate word problems.
Counting strategies (Level 2) represent more than efficient procedures for calculating answers for addition and subtraction problems. They indicate a level of understanding of number concepts and abilities to reflect on numbers as abstract quantities. Children’s Mathematics: Cognitively Guided Instruction (p. 28)
“As children progress to Level 2 strategies, they no longer need representations that show each quantity as a group of objects.” (OA Progressions, p. 16) As children leave behind the need to represent each quantity, what implications does that have for us as teachers?
Typical Instructional Sequence Abstract ? Representing problem situations with equations Concrete What’s missing from this sequence? Model with Objects
Ali has 4 toy cars. David has 3 toy cars. How many toy cars do they have together? Concrete 4 + 3 = 7 Representational Abstract Use concrete objects to form two groups and put the two groups together. 1,2,3 4 1,2,3 1,2,3,4,5,6,7…7 cars
Representational Math Drawings Drawing pictures that represent concrete objects provides a bridge to help young children connect their concrete representations to the abstract world of mathematical symbols. “Math drawings facilitate reflection and discussion because they remain after the problem has been solved.” (OA Progressions, p. 8) Children need many opportunities to create such drawings.
CCSSM Suggested Math Drawing:Tape Diagram What is a tape drawing? A drawing that looks like a segment of tape, used to illustrate number relationships. Also known as strip diagrams, bar model, fraction strip, or length model. (CCSSM Glossary, p. 87)
Diagrams: Tape, Part-Whole, and Number-Bond OA Progressions, page 16 • Review the three different diagrams found in the margin. • Discuss similarities and differences with your shoulder partner.
Ali has 4 toy cars. David has 3 toy cars. How many toy cars do they have together? Representational Concrete 7 cars Abstract 5,6,7 4 4 + 3 = 7 Use concrete objects to form two groups and put the two groups together. Abstracting to another level. 7 cars 1,2,3 4 1,2,3 4 5, 6, 7 1,2,3,4,5,6,7…7 cars
Practicing Level 2 and Tape Diagrams Use the Word Problem Cards. (Remove the Start Unknown and Comparison Cards.) For each problem: • Solve using a Level 1 and/or Level 2 strategy. • Create a tape diagram (both discrete and continuous). • As you work, refer to the diagrams in the margin on page 16 of OA Progressions.
These diagrams are a major step forward because the same diagrams can represent the adding and subtracting situations for all kinds of numbers students encounter in later grades (multi-digit whole numbers, fractions, decimals, variables). (OA Progressions, p. 17)
Learning Intentions We are learning to… • Make a meaningful transition from concrete representations to abstract representation. • Use tape diagrams as an effective tool to support quantitative reasoning. We will be successful when we can… • Use discrete and continuous models to illustrate word problems.