Download
1 / 33
380 likes | 768 Views
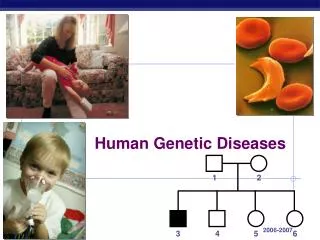
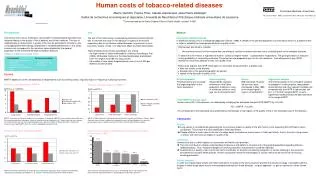
The spectrum of human diseases. Cystic fibrosis. thalassemia. Huntington’s. <5%. cancer. Mapping complex loci. PAF – population attributable factor: Fraction of the disease that would be eliminated if the risk factor were removed High PAF for single gene conditions (>50% for CF)

E N D
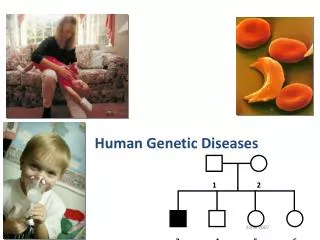
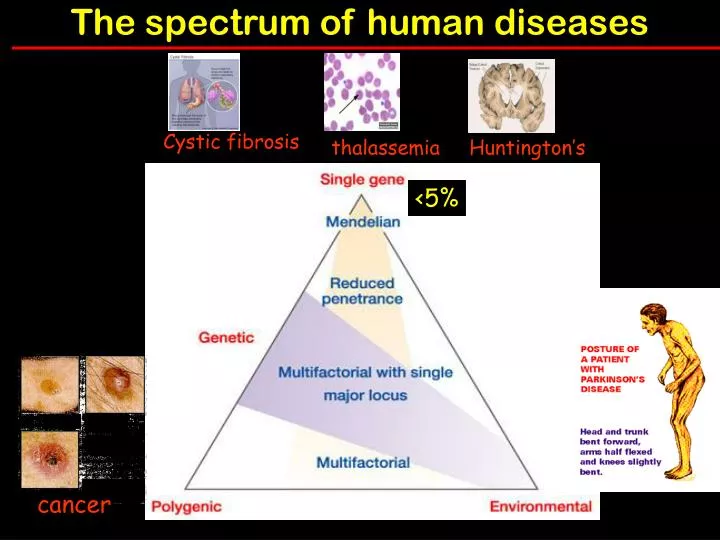
The spectrum of human diseases Cystic fibrosis thalassemia Huntington’s <5% cancer
Mapping complex loci PAF – population attributable factor: Fraction of the disease that would be eliminated if the risk factor were removed High PAF for single gene conditions (>50% for CF) Low PAF for complex disease (< 5% for Alzheimer’s)
Identifying genes involved in complex diseases Steps • Perform family, twin or adoption studies - check for genetic component • Segregation analysis - estimate type and frequency of susceptibility alleles • Linkage analysis - map susceptibility loci • Population association - identify candidate region • Identify DNA sequence variants conferring susceptibility
Linkage versus Assocciation Linkage analyses search for regions of the genome with a higher-than-expected number of shared alleles among affected individuals within a family. Used to identify rare high-risk disease alleles <500 markers needed for initial genome scan Association studies compare the allele frequency of a polymorphic marker, or a set of markers, in unrelated patients (cases) and healthy controls to identify markers that differ significantly between the two groups. Used to identify common modest-risk disease variants Higher density of markers needed e.g. HapMap uses association data
Haplotype analysis • specific combination of 2 or more DNA marker alleles situated close together on the same chromosome (cis markers) • SNPs most commonly used markers in haplotypes. • series of closely linked mutations accumulate over time in the surviving generation derived from a common ancestor. • powerful genetic tool for identifying ancient genetic relationships. • Alleles at separate loci that are associated with each other at a frequency that is significantly higher than that expected by chance, are said to be in linkage disequilibrium
Direct versus indirect association analysis. a, In direct association analysis,all functional variants (red arrows) are catalogued and tested for association with disease. A GeneSNPs image of the CSF2 gene is shown. Genomic features are shown as boxes along the horizontal axis (for example, blue boxes indicate exons). Polymorphisms are shown as vertical bars below the axis, with the length of the line indicating allele frequency and colour indicating context (for example, red indicates coding SNPs that change amino acids). b, For indirect association analysis, all common SNPs are tested for function by assaying a subset of tagSNPs in each gene (yellow arrows), such that all unassayed SNPs (green arrows) are correlated with one or more tagSNPs. Effects at unassayed SNPs (green arrows) would be detected through linkage disequilibrium with tagSNPs. Images adapted from GeneSNPs (http://www.genome.utah.edu/genesnps).
Ancient disease loci are associated with haplotypes • Start with population genetically isolated for a long time such as Icelanders or Amish • Collect DNA samples from subgroup with disease • Also collect from equal number of people without disease • Genotype each individual in subgroups for haplotypes throughout entire genome • Look for association between haplotype and disease phenotype • Association represents linkage disequilibrium • If successful, provides high resolution to narrow parts of chromosomes
Why is it still so difficult? Genetic heterogeneityMutations at more than one locus cause same phenotype e.g. thalassemias • Caused by mutations in either the a or b-globin genes. • Linkage analysis studies therefore always combine data from multiple families
Variable expressivity - Expression of a mutant trait differs from person to person
Phenocopy • Disease phenotype is not caused by any inherited predisposing mutation • e.g. BRCA1 mutations • 33% of women who do not carry BRCA1 mutation develop breast cancer by age 55
Incomplete penetrance – when a mutant genotype does not always cause a mutant phenotype • No environmental factor associated with likelihood of breast cancer • Positional cloning identified BRCA1 as one gene causing breast cancer. • Only 66% of women who carry BRCA1 mutation develop breast cancer by age 55 • Incomplete penetrance hampers linkage mapping and positional cloning • Solution – exclude all nondisease individuals form analysis • Requires many more families for study
Polygenic inheritance • Two or more genes interact in the expression of phenotype • QTLs, or quantitative trait loci • Unlimited number of transmission patterns for QTLs • Discrete traits – penetrance may increase with number of mutant loci • Expressivity may vary with number of loci • Many other factors complicate analysis • Some mutant genes may have large effect • Mutations at some loci may be recessive while others are dominant or codominant
Polygenic inheritance E.g heart attacks or cholesterol levels Sudden cardiac death (SCD)
Breast cancer Common condition – familial or sporadic forms Although a genetic basis for familial BC identified, the causes of sporadic disease still unknown Mutations in 2 loci account for 20-25% of early onset (<45 years) breast cancer cases due to inherited factors • BRCA1: mutations found in 80-90% of families with both breast and ovarian cancer • BRCA2: mutations mainly in male breast cancer families Sudden cardiac death (SCD)
Alzheimer’s disease Affects 5% of people >65 years and 20% of people over 80 has familial (early-onset) or sporadic (late-onset) forms, although pathologically both are similar Aetiology of sporadic forms unknown familial AD – mutations in APP, presenilin-1 and 2 Sporadic AD – strong association with APOe4, Apolipoprotein e4, which affects age of onset rather than susceptibility 3 major alleles (APO E2, E3, and E4) Sudden cardiac death (SCD)
Epigenetics – differential imprinting Genetic conditions that are independent of the DNA sequence
Epigenetics – differential imprinting Prader-Willi syndrome Angelman syndrome molecular defect involves a ~2 Mb imprinted domain at 15q11–q13 that contains both paternally and maternally expressed genes failure to thrive during infancy, hyperphagia and obesity during early childhood, mental retardation, and behavioural problems characteristics include mental retardation, speech impairment and behavioural abnormalities defect lies within the imprinted domain at 15q11–q13
Genetic causes Prader-Willi syndrome Angelman syndrome 70% have a deletion of the PWS/AS region on their maternal chromosome 15 7% have paternal uniparental disomy for chromosome 15 (the individual inherited both chromosomes from the father, and none from the mother) 3% have an imprinting defect 11% have a mutation in UBE3A 1% have a chromosome rearrangement 11% have a unknown genetic cause 70% have a deletion of the PWS/AS region on their paternal chromosome 15 25% have maternal uniparental disomy for chromosome 15 (the individual inherited both chromosomes from the mother, and none from the father) 5% have an imprintingdefect <1% have a chromosome abnormality including the PWS/AS region
Molecular pathology Nomenclature Effect of mutant allele and not the sequence Loss of function Gain of function Gene to disease Disease to gene Chromosomal disorders
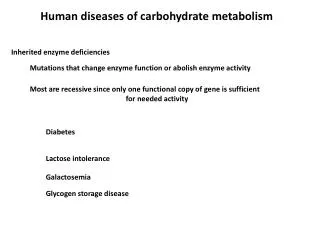
The Haemoglobinopathies • Thalassemias • Anaemias associated with impaired synthesis of Hb subunits • Thalassaemias can arise from different mutations causing a disease of varying severity. • a0/b0 thalassaemias – globin chain absent • a+/b+ thalassaemias – normal globin chain in reduced amounts
Evolution of globin superfamily Fig. 21.16
Organisation of globin genes Fig. 21.16
Developmental variation in gene expression a-like chains - z & a b-like chains - e, g, d, b Fig. 21.16 Adult human made of a2b2 – 97%; a2d2 - ~2%; a2g2-~1% (fetal persistence)
Gene expression controlled by location e – embryonic yolk sac g – yolk sac & fetal liver b &d– adult bone marrow Fig. 21.16
a- thalassemias deletion of one or both a globins in an a gene cluster Severity depends on whether the individual has 1,2,3, or 4 missing a globin genes. GENOTYPE PHENOTYPE a+ a+ a+a+ Normal a+a a+a+ Silent carrier asymptomatic condition. a-thalassaemia – 2 a+ a a+a a-thalassaemia trait minor anaemic conditions a+a+ a a a+a a a HbH mild – moderate anaemia a a a a Hydrops foetalis foetus survives until around birth
b- thalassemias Non coding regulatory regions Exons Introns (InterVening Sequences) 3’ cleavage mutant deletion RNA splicing mutant transcription mutant nonsense mutation frameshift insertion frameshift deletion • Mutations in b globin cluster are of different types • gene deletion • transcriptional mutation • RNA processing mutations • RNA cleavage signal mutations • Nonsense & frameshift mutations
Main genetic mechanisms that contribute to the phenotypic diversity of the b-thalassaemias.
Reading HMG3 by T Strachan & AP Read : Chapter 14 AND/OR Genetics by Hartwell (2e) chapter 11 References on Cystic fibrosis: Science (1989) vol 245 pg 1059 by JM Rommens et al (CF mapping) J. Biol Chem (2000) vol 275 No 6 pp 3729 by MH Akabas (CFTR) Optional Reading on Molecular medicine Nature (May2004) Vol 429 Insight series • human genomics and medicine pp439 (editorial) • Mapping complex disease loci in whole genome studies by CS Carlson et al pp446-452