Download
1 / 14
140 likes | 240 Views
Financial Markets Review: First Quarter 2009 May 19 , 2009. Presented by: Tim Noel, Ph.D., CFA. 2000. 2001. 2002. 2003. 2004. 2005. 2006. 2007. 2008. 2009. Technology bubble bursts. Fed lowers interest rates. More leverage, risk taking, and housing bubble.

E N D
Financial Markets Review: First Quarter 2009May 19, 2009 Presented by: Tim Noel, Ph.D., CFA
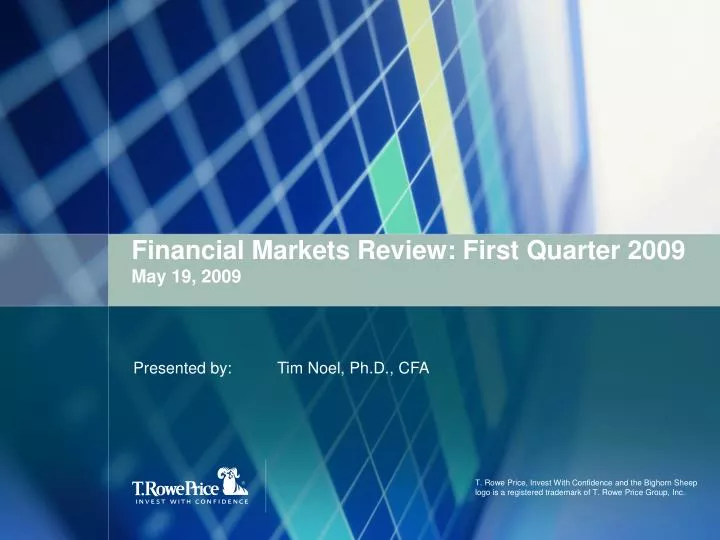
2000 2001 2002 2003 2004 2005 2006 2007 2008 2009 Technology bubble bursts Fed lowers interest rates More leverage, risk taking, and housing bubble Increased asset securitization Credit standards are weakened Housing bubble bursts Mortgage security prices fall Liquidity dries up Widespread asset write-downs increase fear and uncertainty Companies (particularly financials) are forced to de-lever Consumers are forced to de-lever Brief, incomplete history of how we got here
Capital Market Returns by Asset Class Ended March 31, 2009 Growth What happened this quarter Investors are exhibiting some risk appetite Sources: Credit Suisse; Barclays Capital; Standard & Poor’s; MSCI; Russell
What happened this quarter S&P 500 Index 2 January ISM Manufacturing index plunges to a 28-year low of 32.4% Jan: -8.43% Feb: -10.65% Mar: +8.76% 1Q09: -11.01% 18 March Fed announces expanded asset purchase programs Closing Price (YTD) 23 March Treasury unveils toxic asset plan details 9 January Unemployment tops 7%, highest in 16 years. 10 March Citigroup indicates it was profitable in January and February. Barney Frank makes hopeful comments on reinstating the uptick rule 10 February Uncertainty over stimulus bill passing the House of Representatives 20 January Obama inauguration 30 March U.S. government officially rejects viability plans from GM and Chrysler 23 February Report that AIG may post massive losses. Citigroup talks with government about increasing stake. 26 February Health care stocks fall after House calls for cuts on payments to private insurance plans Source: Factset
Investor Fear Fears of economic and earnings weakness Severe Sell Off Severe high velocity sell off in risky assets Forced Liquidations Indiscriminate selling and forced liquidations Fundamental Disconnect Prices become disconnected from fundamentals Investment Opportunities Fundamental analysis identifies opportunities What happened this quarter Chain Reaction CBOE Market Volatility Index (VIX) Fear and panic: Investors shoot first, ask questions later. Opportunities arise. Panic eases: Fundamentals are important again. Quality rewarded. Jul-08 Aug-08 Sep-08 Oct-08 Nov-08 Dec-08 Jan-09 Feb-09 Mar-09 Source: Factset
Economics summary Base case: visibility to gradual recovery by year-end (55%) • Restructuring in the financial sector will slow down the recovery in late 2009 and into 2010 • Accumulated imbalances need to be corrected before growth returns • Housing supply overhang will have a long tail • Correction of business inventories are starting to take hold • Expecting declining Real GDP until Q309 • Government spending to provide the only positive contribution until 4Q09 when the consumer and business begin slight growth in spending • Unemployment and savings rate • Expecting unemployment rate to hit 9.2% by the end of 2009 • Secular rebound in the personal savings rate after 25-year decline (peaked in 1981 at 12.5%) – expecting it to hit 6.3% by 2010
First signs of stabilization bring visibility to gradual recovery by year-end Signs of stabilization? Real Gross Domestic Product (SAAR, Bil.Chn.2000$) Q1 1989 – Q1 2009 Sources: Bureau of Labor Statistics; Haver Analytics
Signs of stabilization? Pressures on labor markets appear to be stabilizing after intensifying in December and January All Employees: Total Nonfarm (SA) Difference – Period to Period January 31, 1985 – March 31, 2009 Sources: Bureau of Labor Statistics; Haver Analytics
Signs of stabilization? Consumers felt the pressure of the labor market decline; economic fears led to less consumption and more saving Real Personal Consumption Expenditures January 31, 1990 – February 28, 2009 Sources: Bureau of Labor Statistics; Haver Analytics
Mortgage rates hit historic lows with the Fed buying Agency MBS Signs of stabilization? 30-year Mortgage Rates March 31, 2000 – March 31, 2009 Source: Bloomberg
The IMF now forecasts total global write-downs to reach $4.1 trillion The new normal – continued deleveraging and loss recognition Global Financial Services Quarterly Write-downs and Recapitalization Through March 31, 2009 Source: Bloomberg; IMF Global Financial Stability Report - April 2009
U.S. government intervention will remain elevated with new programs The new normal – massive government intervention to provide liquidity The Federal Reserve Balance Sheet Composition December 31, 2007 – March 31, 2009 Source: Federal Reserve Board, Haver Analytics
What’s next? • Credit conditions must continue to improve. Companies must be able to finance their activity. Watch credit spread trends. • The pace of deleveraging must slow. Indiscriminate, forced selling of equity and fixed-income securities must continue to diminish. • Fiscal and monetary stimulus measures must bite. This will give businesses and investors confidence to spend and invest. • A deflationary mindset must be averted. The velocity of spending will grind to a halt if consumers and businesses believe prices will get continually cheaper.
What’s next? Old Norm New Norm Transition Period