Download
1 / 12
120 likes | 262 Views
Dimension Reduction and Sampling in the Scientific Data Management Center (SDM-ISIC). Chandrika Kamath and Imola K. Fodor Center for Applied Scientific Computing Lawrence Livermore National Laboratory SciDAC SDM-ISIC Kickoff Meeting July 10, 2001.

E N D
Dimension Reduction and Sampling in the Scientific Data Management Center (SDM-ISIC) Chandrika Kamath and Imola K. FodorCenter for Applied Scientific ComputingLawrence Livermore National LaboratorySciDAC SDM-ISIC Kickoff MeetingJuly 10, 2001 UCRL-PRES-144537: This work was performed under the auspices of the U.S. Department of Energy by University of California Lawrence Livermore National Laboratory under contract no. W-7405-Eng-48
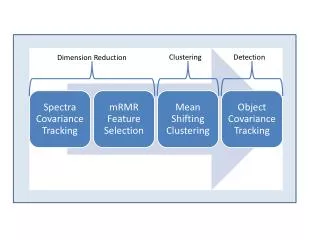
We are borrowing ideas from data mining to improve the management of data • Scientific data are often massive and high dimensional • Need efficient techniques for storage and access • Efficient indexing through vertical partitioning (LBNL: task 2c.i) • Clustering (ORNL: task 3c.i) • Our goal: make these tasks more tractable by reducing the number of dimensions We want to identify the most important attributes of a data item so further processing can be simplified without compromising the quality of the final results.
MIT’s Technology Review (Jan ‘01): Data mining is a top ten emerging technology • Data mining: The semi-automatic discovery of patterns, associations, anomalies, and statistically significant structures in data • Pattern recognition: The discovery and characterization of patterns • Pattern: An ordering with an underlying structure • Feature: Extractable measurement or attribute Pattern: radio galaxy with a bent-double morphology Features: number of “blobs” maximum intensity in a blob spatial relationship between blobs (distances and angles)
“Big picture” view of data mining Object recognition and Feature Extraction Dimension Reduction Pattern Recognition Raw Data Information Features Features Data items
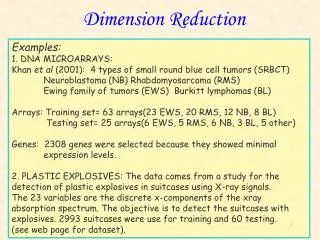
Classifying radio-emitting galaxies with a bent-double morphology in the FIRST survey • Faint Images of the Radio Sky at Twenty centimeters • Using the NRAO Very Large Array (VLA), B configuration • 10,000 square degrees survey, ~90 radio galaxies / square-degree • 1.8’’ pixels, resolution 5’’, rms 0.15mJy • Images maps and catalog available
FIRST data set: Detecting bent-doubles in 250GB image data, 78MB catalog data Image Map 1150 pixels Catalog 720K entries 1550 pixels ~32K image maps, 7.1MB each 64 pixels Catalog entry { Radio Galaxy
Our approach for classifying radio-galaxies using feature from the catalog • Consider a region of interest • Group catalog entries within the ROI • Separate sources based on # catalog entries • 1-entry: unlikely to be bent-doubles • > 3-entry: all “interesting” • classify 2- and 3-entry sources separately • a small training set becomes smaller (313 ---> 118 + 195) • Focus on the 3-entry galaxies • extract features: 103 features • create a decision tree using the training set • use the tree to classify the unlabeled galaxies
We have used simple feature selection techniques to reduce number of features • Input from domain experts • EDA techniques: parallel plots and box plots • Wrapper approach
There are also more complex techniques for dimension reduction • Principal component analysis • transform the features to be mutually uncorrelated • focus on directions that maximize the variance • N data items in d dimensions • find the d-dimensional mean vector • obtain the d x d covariance matrix • obtain the d eigenvalues and eigenvectors of the covariance matrix • keep k largest eigenvectors (k << d) • project the (original data - mean) into the space spanned by these vectors The eigenvectors or principal components (PCs) are mutually orthogonal and the original data is a linear combination of these PCs
We applied PCA to the problem of bent-double classification • The first 20 PCs explained about 90% of the variance • Eliminate unimportant variables • eliminate variable with largest coefficient in e-vector corresponding to smallest e-value • repeat with the e-vector for the next smallest e-value • continue till left with 20 variables Using only the 31 features found through EDA and PCA lowers the decision tree error from 11.1% to 9.5%
PCA does not provide a perfect solution to the problem of dimension reduction • The linear combination makes interpretation difficult • use the PCs to find important variables • May not produce separation of clusters • need to preserve “interesting” properties of data We want to consider non-linear and non-orthogonal projections
Our current plan for task 3b.i • Work with a climate data set from Ben Santer (LLNL) • understand issues from the climate viewpoint • identify features • apply PCA • investigate other techniques (projection pursuit, independent component analysis, non-linear PCA) • Implementation issues • incremental implementation for a growing dataset • sampling to reduce number of items • Collaboration with ORNL, LBNL • feed reduced dimension dataset to task 3c.I (ORNL) • understand the HyCeltyc algorithm (LBNL) • STAR HEP data (LBNL)