Download
1 / 11
120 likes | 248 Views
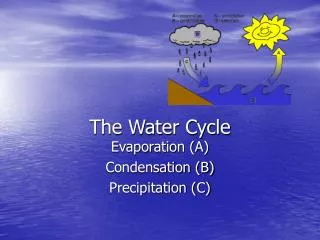
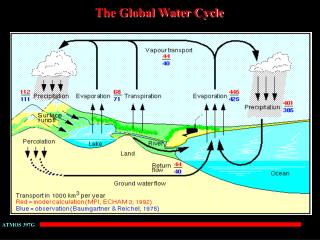
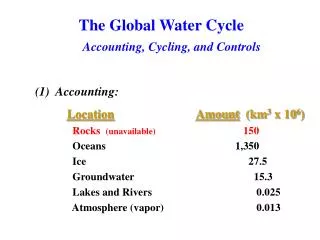
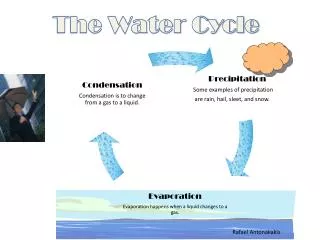
Modeling the Global Water Cycle. Cheryl Gann NCSSM Instructor of Mathematics gann@ncssm.edu Special Thanks to Linda Schmalbeck, NCSSM Instructor of Biology, for the activity inspiration. Six Major Reservoirs. Water Cycle Processes. Residence Time Comparison.

E N D
Modeling the Global Water Cycle Cheryl Gann NCSSM Instructor of Mathematics gann@ncssm.edu Special Thanks to Linda Schmalbeck, NCSSM Instructor of Biology, for the activity inspiration.
Residence Time Comparison Table on Left: Pidwirny, M. (2006). "The Hydrologic Cycle". Fundamentals of Physical Geography, 2nd Edition. Date Viewed 1/20/2013. http://www.physicalgeography.net/fundamentals/8b.html. *Some of the ice in the ice sheet that covers most of the continent of Antarctica has been there for nearly a million years: http://www.windows2universe.org/earth/polar/cryosphere_intro.html
Residence Time Comparison “A drop of water may spend over 3,000 years in the ocean before moving on to another part of the water cycle while a drop of water spends an average of just eight days in the atmosphere before falling back to Earth.” http://www.windows2universe.org/earth/polar/cryosphere_intro.html
Glacier Melting • Global sea level is currently rising as a result of both ocean thermal expansion and glacier melt, with each accounting for about half of the observed sea level rise, and each caused by recent increases in global mean temperature. • For the 21st century, the IPCC projected that melting of glaciers and ice caps will contribute roughly 10-12 cm to sea level rise, with an uncertainty of roughly a third. This would represent a melting of roughly a quarter of the total amount of ice tied up in mountain glaciers and small ice caps. • The IPCC notes that as much as 33% of coastal land and wetland habitats are likely to be lost in the next hundred years if the level of the ocean continues to rise at its present rate. National Snow & Ice Data Center. State of the Cryosphere. http://nsidc.org/cryosphere/sotc/glacier_balance.html. Intergovernmental Panel on Climate Change (IPCC). 2007. IPCC Fourth Assessment Report - Climate Change 2007: The Physical Science Basis Summary for Policymakers.
Sea Rise Calculations of water will raise the oceans approximately of water will raise the oceans approximately
Overdrafting Overdraftingis the process of extracting groundwater beyond the equilibrium yield of the aquifer. • Overdrafting increases the total amount of water within the hydrosphere. • Since more water is subject to transpiration and evaporation, there is accretion in water vapor and cloud cover which are the primary absorbers of infrared radiation in the Earth's atmosphere. • Large-scale groundwater extraction for irrigation, drinking water or industry results in an annual rise in sea levels of approximately 0.8 mm, accounting for about one-quarter of total annual sea-level rise (3.1 mm). • According to hydrologists from Utrecht University and the research institute Deltares, the rise in sea levels can be attributed to the fact that most of the groundwater extracted ultimately winds up in the sea. http://www.uu.nl/EN/Current/Pages/Wereldwijdonttrekkenvangrondwaterleidttotzeespiegelstijging.aspx
Saltwater Intrusion Sea water moving inland is called a saltwater intrusion. • Groundwater extraction is the primary cause of saltwater intrusion. • Groundwater extraction can lower the level of the freshwater table, reducing the pressure exerted by the freshwater column and allowing the denser saltwater to move inland. Barlow, Paul M. (2003). "Ground Water in Freshwater-Saltwater Environments of the Atlantic Coast". USGS.
“Our 50-year observed global surface salinity changes, combined with changes from global climate models, present robust evidence of an intensified global water cycle at a rate of 8 ± 5% per degree of surface warming. This rate is double the response projected by current-generation climate models and suggests that a substantial (16 to 24%) intensification of the global water cycle will occur in a future 2° to 3° warmer world.” "Ocean Salinities Reveal Strong Global Water Cycle Intensification During 1950 to 2000”. Science336 (6080): 455-458. 27 April 2012.