Download
1 / 22
220 likes | 298 Views
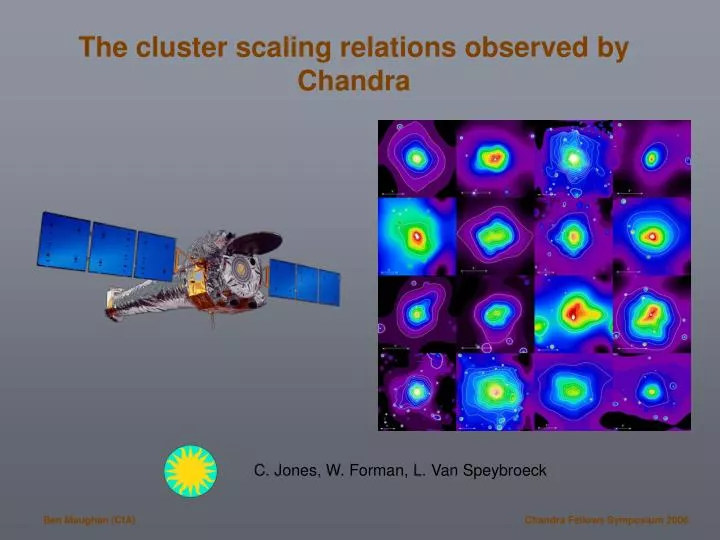
C. Jones, W. Forman, L. Van Speybroeck. The cluster scaling relations observed by Chandra. Introduction. Galaxy clusters are powerful cosmological probes They are dominated by dark matter and their properties are sensitive to dark energy

E N D
C. Jones, W. Forman, L. Van Speybroeck The cluster scaling relations observed by Chandra Chandra Fellows Symposium 2006
Introduction • Galaxy clusters are powerful cosmological probes • They are dominated by dark matter and their properties are sensitive to dark energy • Measurements of e.g. mass function, gas fraction and apparent evolution can place useful cosmological constraints • Provide independent constraints to e.g. CMB, SNIa with different degeneracies and systematics • Best cosmology with clusters requires mass estimates Chandra Fellows Symposium 2006
Measuring Cluster Masses • Clusters are ~85% dark matter and ~15% baryons • Baryons are dominated by hot X-ray emitting gas • Very luminous so can be detected to z~1.5 • Emissivity 2 so projection effects minimised Chandra Fellows Symposium 2006
Measuring Cluster Masses • Clusters are ~85% dark matter and ~15% baryons • Baryons are dominated by hot X-ray emitting gas • Very luminous so can be detected to z~1.5 • Emissivity 2 so projection effects minimised • Use X-rays to measure radial profiles of gas and kT • Under assumption of hydrostatic equilibrium, solve for total gravitating mass • However, such detailed measurements require LOTS of photons – hard for less luminous / more distant clusters Chandra Fellows Symposium 2006
Scaling Relations • Current and future cluster surveys will detect 1000’s of clusters out to high z • Need efficient method to estimate masses from simple properties measured in survey data (e.g. kT, Lx) • Simple self-similar models predict tight scaling relations between basic cluster properties (e.g. LxkT2, MkT3/2) • Observations find relations do exist, but differ from SS predictions (e.g. LxkT3) • Indicates importance of non-gravitational processes Chandra Fellows Symposium 2006
Non-Gravitational Processes • Dense gas in cluster cores radiates efficiently and cools • Bright, cool cores in many clusters • Scaled temperature profiles from Vikhlinin et. al. (2006) Chandra Fellows Symposium 2006
Non-Gravitational Processes • Dense gas in cluster cores radiates efficiently and cools • Bright, cool cores in many clusters • Large amounts of very cool gas not detected in cores • Cooling balanced by energy input • Prime candidate: AGN activity, details uncertain • Mergers also important to cluster energetics Chandra Fellows Symposium 2006
Non-Gravitational Processes • Dense gas in cluster cores radiates efficiently and cools • Bright, cool cores in many clusters • Large amounts of very cool gas not detected in cores • Cooling balanced by energy input • Prime candidate: AGN activity, details uncertain • Mergers also important to cluster energetics • Study of scaling relations gives insight into when, where and how these processes affect cluster properties Chandra Fellows Symposium 2006
The Sample • 128 clusters observed with Chandra ACIS-I • Includes all such clusters at z>0.1 with published z Chandra Fellows Symposium 2006
Analysis Methods • Use blank sky bg files for spectral and imaging analysis • Measure kT within R500 and iterate until stable • Estimate R500 using Vikhlinin et. al. (2006) MT relation • R500 radius within which mean is 500crit(z) • Generally exclude central region for kT and Lx measurements • Fit surface brightness profile with projected 3D emission measure profile (Vikhlinin et. al. 2006) • Modified -model with core component and steeper slope at large R • Derive gas density profile Chandra Fellows Symposium 2006
Gratuitous Eye Candy adaptively smoothed, 3Mpc per side, in order of z Chandra Fellows Symposium 2006
Gratuitous Eye Candy Drop z<0.1 for the purposes discussed here (leaves 111) adaptively smoothed, 3Mpc per side, in order of z Chandra Fellows Symposium 2006
The L-T Relation • Lx and kT with no correction for cool cores compared with Markevitch (1998) relation for local clusters • Predicted SS evolution removed • CC clusters: kT in core at least 1 cooler than external kT • N.B. local relation corrected for cool cores Chandra Fellows Symposium 2006
The L-T Relation • Plot fractional residuals from local relation against redshift without evolution correction • Solid line marks locus of expected SS evolution • Points should scatter about that Chandra Fellows Symposium 2006
The L-T Relation • Now exclude central 70kpc from Lx and central 0.15 R500 from kT measurements • Consistent with method for local relation Chandra Fellows Symposium 2006
The L-T Relation • Finally exclude central 0.15 R500 for Lx too • Scatter dominated by core properties • Expected SS evolution generally ok • Still some significant deviations from relation Chandra Fellows Symposium 2006
Gas Density Profiles • Compare most significantly deviant clusters with the non-deviant clusters • Plot gas density normalised to crit(z) and radius normalised to R500 (from kT with 0.15 R500 excluded) • Deviant clusters have high gas densities out to ~0.5R500 Chandra Fellows Symposium 2006
Deviant Clusters • Two deviants with best data • Mass profiles consistent with normal systems • Both have striking cold fronts – are these responsible? R500 ZW3146 (z=0.29) MS1455 (z=0.26) Chandra Fellows Symposium 2006
The Lx-Yx Relation • Yx = product of gas mass and temperature (Kravtsov et al. 2006) • Has more robust, low-scatter relation with total mass than other X-ray observables • kT in Yx is with central 0.15 R500 excluded • Lx is not CC corrected Chandra Fellows Symposium 2006
The Lx-Yx Relation • Excluding central 0.15 R500 for Lx gives very tight relation • Lowest scatter of all relations studied here • If Yx good mass proxy, implies Lx outside core is too Chandra Fellows Symposium 2006
The Lx-Yx Relation • Plot fractional residuals from local relation • Predicted evolution is strong, but matches data • Data suggests slightly weaker evolution? Chandra Fellows Symposium 2006
Summary and conclusions • Looked at scaling relations in large sample of Chandra clusters • Deviations/scatter dominated by cluster cores • Lx-kT deviations also revealed subset of clusters with elevated gas density out to large radii • Related to cool cores & cold fronts? • Surprisingly tight Lx-Yx relation outside core • Lx outside core good mass proxy? • Lx-kT deviations outside core due to low kT for M? • SS evolution obeyed in all relations • Possible weaker evolution in Lx-Yx? Chandra Fellows Symposium 2006