Download
1 / 40
400 likes | 555 Views
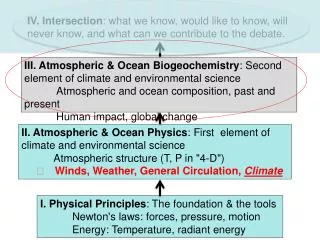
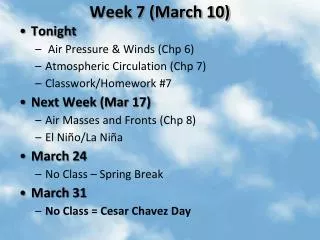
Temporal Variability Tidal Subtidal Wind and Atmospheric Pressure Fortnightly M 2 and S 2 Monthly M 2 and N 2 Seasonal (River Discharge). Estuarine Variability Tidal Subtidal Wind and Atmospheric Pressure Fortnightly M 2 and S 2 Monthly M 2 and N 2

E N D
Temporal Variability Tidal Subtidal Wind and Atmospheric Pressure Fortnightly M2 and S2 Monthly M2 and N2 Seasonal (River Discharge)
Estuarine Variability Tidal Subtidal Wind and Atmospheric Pressure Fortnightly M2 and S2 Monthly M2 and N2 Seasonal (River Discharge)
Tidal Straining Slack Before Ebb Ocean River Tidal Flow Ocean Ebb
End of Ebb Tidal Flow Flood Animation of Shear Instability
Example of Tidal interaction with density gradient Chilean Inland Sea Pitipalena Estuary
CTD Time Series 1 2
1 2
The mean value of the bottom stress over a tidal cycle is: Considering that the flow u may be represented as Dynamically, tidal motion modifies the mean value of bottom friction. where ub is the instantaneous bottom velocity Bottom friction depends then on the tidal current amplitude.
is: The mean over a tidal cycle of because The tidal stress is independent of z as is the barotropic pressure gradient. 0 e.g. Another dynamical implication of tidal flows is the generation of a mean non-linear term: Tidal stresses tend to operate with the barotropic pressure gradient.
Estuarine Variability Tidal Subtidal Wind and Atmospheric Pressure Fortnightly M2 and S2 Monthly M2 and N2 Seasonal (River Discharge)
Wind forcing may: produce mixing induce circulation generate surface slopes But at the air-water interface it is: Subtidal Variability Produced by direct forcing on estuary (local forcing) or on the coastal ocean, which in turn influences estuary (remote forcing - coastal waves) Wind-produced mixing The energy per unit area per unit time or power per unit area generated by the wind to mix the water column is proportional to W3 At a height of 10 m, the power per unit area generated by the wind stress is: The wind power at the air water interface is only 0.1 % of the wind power at a height of 10 m.
Viento Viento cabeza cabeza boca boca cabeza boca Perfil con viento hacia la boca Perfil con viento hacia la cabeza Perfil típico de velocidad neta profundidad Forzamiento por viento Depende de la estratificación de la columna de agua
Ejemplo Estrecho de Meninea en Canal Moraleda (combinando forzamiento por marea, viento, presión)
Ejemplo Meninea (combinando forzamiento por marea, viento, presión) También produce oscilaciones en la picnoclina ==resonancia
x1 sx x2 y x1 x2 x Wind-Induced Surface Slope Can be assessed from the vertical integration of the linearized u momentum equation, with no rotation @ steady state: Note that a westward sx (negative) produces a negative slope. Wind will pile up water in the direction toward which it blows.
The perturbation produced by the wind propagates into the estuary and may cause seiching if the period of the perturbation is close to the natural period of oscillation:
B B cabeza A A boca boca cabeza profundidad z x Indirectamente a través de pendiente de nivel del mar Forzamiento por Gradientes de Presión Atmosférica
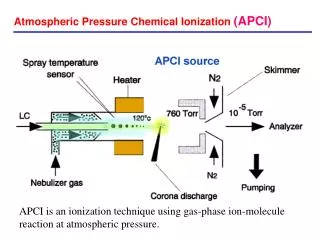
Another mechanism that may cause subtidal variability in estuaries comes from atmospheric or barometric pressure.
Estuarine Variability Tidal Subtidal Wind and Atmospheric Pressure Fortnightly M2 and S2 Monthly M2 and N2 Seasonal (River Discharge)
Depth Mean or Residual Flow Can you see this modulation from the analytical solution? Ocean Neap Spring Mean or Residual Salinity (Density) Depth Increasing salinity
Estuarine Variability Tidal Subtidal Wind and Atmospheric Pressure Fortnightly M2 and S2 Monthly M2 and N2 Seasonal (River Discharge)
N C N C C N
Axial Distributions of Salinity H M H Spring 1999 H M M Fall 1999