Download
1 / 46
460 likes | 581 Views
Cracking the promoter code: Identifying regulatory modules for tissue-specific transcripts. Chris Stoeckert, Ph.D. Center for Bioinformatics & Dept. of Genetics University of Pennsylvania School of Medicine Nov. 15, 2005 University of Nebraska Medical Center. Expression. TFBS1. TFBS2.

E N D
Cracking the promoter code: Identifying regulatory modules for tissue-specific transcripts. Chris Stoeckert, Ph.D. Center for Bioinformatics & Dept. of Genetics University of Pennsylvania School of Medicine Nov. 15, 2005 University of Nebraska Medical Center
Expression TFBS1 TFBS2 TFBS3 TFBS4 TFBS1 TFBS2 TFBS3 TFBS4 http://molbio.info.nih.gov/molbio/gcode.html TFBS = transcription factor binding site What is the code for determining where (and when) a gene is expressed?
Goal is to Identify Combinations of TFBS (cis-Regulatory Modules or CRMs) that Specify Tissue Expression From Wasserman & Sandelin, NRG 2004
A Genomics Unified Schema approach to understanding gene expression Jennifer Dommer, Steve Fischer, Thomas Gan, Greg Grant, John Iodice, Junmin Liu, Elisabetta Manduchi, Joan Mazzarelli, Debbie Pinney, Angel Pizarro, Mike Saffitz, Jonathan Schug, Chris Stoeckert, Trish Whetzel Computational Biology and Informatics Laboratory (CBIL), Penn Center for Bioinformatics
Plasmodium Genome Resource Cryptospiridium Database GUS Beta Cell Biology Consortium Phytophthora Soybean EST Database
GUS is an open source project U. Penn Sanger Institute U. Georgia U. Toronto GUS U. Chicago Kansas U. Flora Centromere Database Virginia Bioinformatics Insitiute
GUS Project Goals • Provide: • A platform for broad genomics data integration • An infrastructure system for functional genomics • Support: • Websites with advanced query capabilities • Research driven queries and mining
GUS Project Resources • Website -- http://www.gusdb.org • News, Documentation, Distributable, GUS-based Projects
GUS Components • Schema • Application Framework • Object/Relational Layer • Plugin API • Pipeline API • Plug-ins • Web DevelopmentKit (WDK)
Identify shared TF binding sites Genomic alignment and comparative sequence analysis SRes, Study BioMaterial annotation RAD EST clustering and assembly DoTS TESS
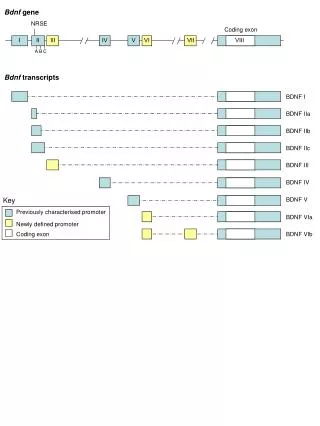
DoTS integrates sequence annotation including where expressed
RAD Contains Detailed Expression Experiments Including Tissue Surveys
But there are too many potential sites! TESS Allows You to Find Potential TFBS
Promoters Features Related to Tissue-Specificity as Measured by Shannon Entropy Jonathan Schug1, Winfried-Paul Schuller2, Claudia Kappen2, J. Michael Salbaum2, Maja Bucan1, Christian J. Stoeckert Jr.1 Center for Bioinformatics, Department of Genetics, University of Pennsylvania, Philadelphia, Pennsylvania Department of Genetics, Cell Biology and Anatomy, University of Nebraska Medical Center, Omaha, Nebraska Genome Biology 2005 6:R33
What is a Liver-Specific Gene? http://expression.gnf.org/ *
Assessing Tissue Specificity of Genes Using Shannon Entropy Shannon entropy is a measure of the uniformity of a discrete probability distribution. Given a set of T tissues, H ranges from 0 for a gene expressed in a single tissue to lg T for a gene expressed uniformly in all T tissues. It works well as a measure of overall tissue-specificity. To measure specificity to a particular tissue, we combine entropy H and the relative expression level in that tissue to get Q. Q = 0 for a tissue when the gene is expressed only in that tissue and Q = 2T for a typical tissue in uniform expression. (a) Very specific liver expression: H=1.6 and Qliver = 2.2, 98612_at cytochrome p450 (b) Near uniform expression : H=4.3 and Qliver=10.2, 104391_s_at Clcn7 chloride channel 7
Agreement between Microarrays and ESTs on Tissue Specificity
CpG Islands are Associated with the Start Sites of Genes with Wide-Spread Expression CpG island = minimum 200 bp, C+G > 0.6, obs./expect. >=0.5
Tissue-Specific and Non-Specific Promoters Have Distinct Base Compositions CpG- CpG+ Multi-Tissue H >= 4.4 Tissue Specific H <= 3.5 Promoters based on DBTSS (http://dbtss.hgc.jp)
Functional relationships of promoter classes based on over-represented GO terms (EASE)
First Clues: TATA Box indicates Tissue Specific; CpG indicates Wide Spread Expression Additional clues: CpG-/TATA+ indicates high expression, secreted proteins while CpG+/TATA- indicates cellular and mitchondrial proteins.
Expanding the Mammalian CArGome Qiang Sun1, Guang Chen2, Jeffrey W. Streb1, Xiaochun Long1, Yumei Yang1, Christian J. Stoeckert, Jr.2 and Joseph M. Miano1 Cardiovascular Research Institute, University of Rochester School of Medicine, Rochester, New York Center for Bioinformatics, University of Pennsylvania, Philadelphia, Pennsylvania Genome Research (in press)
Finding Novel CArG elements • Expect 1 CArG element about every kb just by chance. • CCWWWWWWGG with one mismatch allowed • Use conservation to reduce false positives. • 188 associated with 4362 orthologous genes • 116 had orthologous CArGs • 10/62 known genes found • Repeated with 9169 orthologous genes • 489 predictions • 32/62 known genes found • 60 of 83 predictions were experimentally validated • Transfection assays • Binding assays • Knockdown assays
More Clues: Human-mouse conservation enables identification of valid CArG elements CArG elements associated with many cytoskeletal genes suggesting role of SRF in cytoskeletal dynamics.
Using Bounded Collection Grammars to Identify cis-Regulatory Modules in Tissue Specific Genes Jonathan Schug Max Mintz (CIS, U Penn)
Bounded Collection Grammars Collection production rules for the GR response element in the PEPCK promoter
Rules are evaluated using the receiver operating characteristic (ROC) Each point is a different parameter setting for a rule applied to training sets. Typically use area under the curve (AUC) to rank rules.
Rules are built by increasing complexity when AUC improves Reduce search space by not pursuing unproductive paths. e.g., If (A,B) not better than A or B then don’t need to look at (A,B,C) or (A,B,D) or (A,B,C,D)
The 3-set rule for the PEPCK GR element Note improvements of 2-sets over solos and the 3-set over 2-sets.
Discovering regulatory modules by creating profiles for Gene Ontology Biological Processes based on tissue-specificity scores Elisabetta Manduchi, Jonathan Schug Klaus Kaestner (Genetics, U Penn)
Genes Biological Process Tissue If we focus on biological processes that are predominantly taking place in a given tissue, can we identify regulatory modules common to genes involved in these processes?
liver muscle brain For a given tissue survey, we attach “tissue-specificity” profiles to gene sets defined by GO BPs, based on the ranked lists of genes in each tissue according to increasing Q. • To this end, we use an Enrichment Score (ES) in the spirit of that described in Mootha et al. (2003), as a measure of tissue-specificity for that gene set. • The ES turns out to be equivalent (i.e. equal up to a multiplicative constant) to a Kolmogorov-Smirnov statistic. * * * * * * * * * . . . . . . . . . *steroid metabolism
Application to Tissue Surveys • Have applied to two different Affymetrix-based datasets • Schmueli et al. C R Biol 2003. GeneNote (human) • Su et al. PNAS 2004. GEA2 (human and mouse) • We looked at ~ 2000 GO BPs that we could map to probe sets
significant in liver GO BPs having significantly specific profiles for each tissue can be identified significant in heart and skeletal muscle
Mouse Tissue Survey Tissue-specific GO BPs Human Tissue Survey Tissue-specific GO BPs Learning Tissue-Specific Promoter Motifs GEA2 Reduce and Intersect Liver-specific Steroid metabolism Training Set of Promoter Sequences Training Set of Promoter Sequences Ortholog Pairs (Homologene) Mm-based consensus conserved sequences Hs-based consensus conserved sequences 32 POS, 365 NEG UCSC conserved sequences Positive Solos Positive Solos ROC area > 0.5
Common solos (31) Mm-based collections (30) Hs-based collections (83) (13) Common collections GATA MYCMAC/USF AIRE CAAT ER-LEFT TCF11 TTAC/EFC/NCX/VBP PBX INI AATC SREBP DBP Forkhead E4B EBOX CCAA CREB/ATFS8/CART1/CHX10/NKX25 G_AA/CEBP/HLF TAACC LXR HNF1 ALX4 HNF4/TCF4/COUP/PPAR PPAR-LEFT ROAZ AML/PEBP BACH/NFE2/NRF2 ZTA P53 GNCF/SF1 Liver-specific from Krivan and Wasserman (2001) Known Liver TFs
Learning Liver Specific CRMs for Steroid Metabolism • AIRE • P53 • ER-LEFT • {CREB/ATF, GATA} • {GATA, GNCF/SF1} • {Forkhead, GATA} • {GATA, G_AA/CEBP/HLF} • {GATA, SREBP} • {GATA, TAACC} • {GATA, ZTA} • {AATC, SREBP} • {CAAT, SREBP} • {BACH/NFE2/NRF2, G_AA/CEBP/HLF} Without imposing prior knowledge, end up with rules that are highly enriched for TFs expected to play a role in liver-specific streroid metabolism.
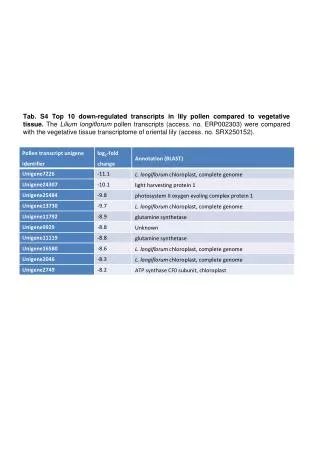
Testing a learned CRM for liver steroid metabolism using a liver HNF3-beta (FoxA2) knock out mouse study • {Forkhead, GATA} set rule applies to HNF3-beta/FoxA2 • Search promoters of genes down-regulated in liver as measured on PancChip microarray • Pancreas-focused array with 7356 known genes. • 52 (0.7%) map to steroid metabolism. • 71 genes down-regulated • 7 (10%) map to steroid metabolism. Genes down-regulated by knockout of a forkhead protein (Hnf3-beta) are significantly enriched in steroid metabolism
More Clues: We can identify candidate CRMs from top-ranking GO Biological Processes for tissues Tested a candidate CRM for liver steroid metabolism with a knock-out mouse. Support for role of one of the factors but not enough sensitivity for seeing both factors.
Future Directions • Apply learning methods to many tissues and processes incorporating multiple surveys • Add novel motifs to learning process • Use ChIP and tissue-focused expression datasets to better evaluate Our goal is to make inferences of the form: "The gene set G shows specificity for tissue T and is regulated by module M in this context".