Download
1 / 1
10 likes | 75 Views
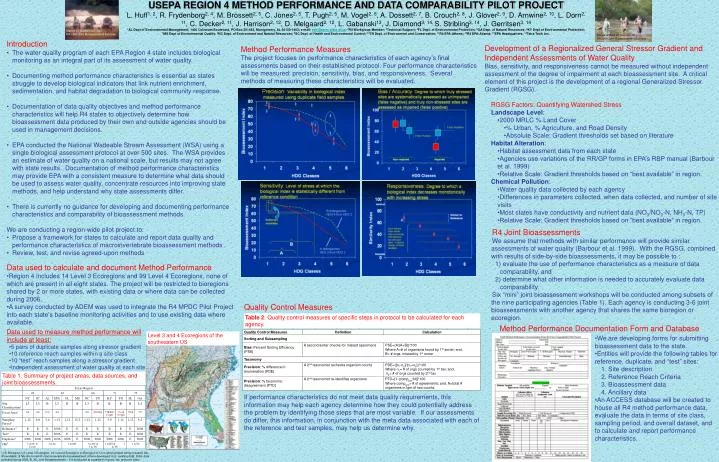
USEPA REGION 4 METHOD PERFORMANCE AND DATA COMPARABILITY PILOT PROJECT

E N D
USEPA REGION 4 METHOD PERFORMANCE AND DATA COMPARABILITY PILOT PROJECT L. Huff1, 2, R. Frydenborg2, 4, M. Brossett2, 5, C. Jones2, 5, T. Pugh2, 5, M. Vogel2, 6, A. Dossett2, 7, B. Crouch2, 8, J. Glover2, 9, D. Arnwine2, 10, L. Dorn2, 11, C. Decker2, 11, J. Harrison2, 12, D. Melgaard2, 12, L. Gabanski13,J. Diamond3, 14, S. Stribling3, 14, J. Gerritsen3, 14 1AL Dept of Environmental Management; 1400 Coliseum Boulevard, PO Box 301463, Montgomery, AL 36130-1463; e mail: esh@adem.state.al.us; 2R4 Workgroup Member; 3Technical Support; 4FL Dept. of Environmental Protection; 5GA Dept. of Natural Resources; 6KY Dept of Environmental Protection; 7MS Dept of Environmental Quality; 8NC Dept. of Environment and Natural Resources; 9SC Dept. of Health and Environmental Control; 10TN Dept. of Environment and Conservation; 11R4 EPA-Athens; 12R4 EPA-Atlanta; 13EPA Headquarters; 14Tetra Tech, Inc. Majors Cr (Baldwin Co., AL) R4 1996 Joint Bioassessment Exercise Sougahatchee Cr (Lee Co., AL) R4 2004 Joint Bioassessment Exercise • Introduction • The water quality program of each EPA Region 4 state includes biological monitoring as an integral part of its assessment of water quality. • Documenting method performance characteristics is essential as states struggle to develop biological indicators that link nutrient enrichment, sedimentation, and habitat degradation to biological community response. • Documentation of data quality objectives and method performance characteristics will help R4 states to objectively determine how bioassessment data produced by their own and outside agencies should be used in management decisions. • EPA conducted the National Wadeable Stream Assessment (WSA) using a single biological assessment protocol at over 500 sites. The WSA provides an estimate of water quality on a national scale, but results may not agree with state results. Documentation of method performance characteristics may provide EPA with a consistent measure to determine what data should be used to assess water quality, concentrate resources into improving state methods, and help understand why state assessments differ. • There is currently no guidance for developing and documenting performance characteristics and comparability of bioassessment methods. • We are conducting a region-wide pilot project to: • Propose a framework for states to calculate and report data quality and performance characteristics of macroinvertebrate bioassessment methods . • Review, test, and revise agreed-upon methods • Development of a Regionalized General Stressor Gradient and Independent Assessments of Water Quality • Bias, sensitivity, and responsiveness cannot be measured without independent assessment of the degree of impairment at each bioassessment site. A critical element of this project is the development of a regional Generalized Stressor Gradient (RGSG). • RGSG Factors: Quantifying Watershed Stress • Landscape Level: • 2000 MRLC % Land Cover • % Urban, % Agriculture, and Road Density • Absolute Scale: Gradient thresholds set based on literature • Habitat Alteration: • Habitat assessment data from each state • Agencies use variations of the RR/GP forms in EPA’s RBP manual (Barbour et al. 1999) • Relative Scale: Gradient thresholds based on “best available” in region. • Chemical Pollution: • Water quality data collected by each agency • Differences in parameters collected, when data collected, and number of site visits • Most states have conductivity and nutrient data (NO3/NO2-N, NH3-N, TP) • Relative Scale: Gradient thresholds based on “best available” in region. Method Performance Measures The project focuses on performance characteristics of each agency’s final assessments based on their established protocol. Four performance characteristics will be measured: precision, sensitivity, bias, and responsiveness.Several methods of measuring these characteristics will be evaluated. • R4 Joint Bioassessments • We assume that methods with similar performance will provide similar assessments of water quality (Barbour et al. 1999). With the RGSG, combined with results of side-by-side bioassessments, it may be possible to : • evaluate the use of performance characteristics as a measure of data comparability, and • determine what other information is needed to accurately evaluate data comparability. • Six “mini” joint bioassessment workshops will be conducted among subsets of the nine participating agencies (Table 1). Each agency is conducting 3-6 joint bioassessments with another agency that shares the same bioregion or ecoregion. • Data used to calculate and document Method Performance • Region 4 includes 14 Level 3 Ecoregions and 99 Level 4 Ecoregions, none of which are present in all eight states. The project will be restricted to bioregions shared by 2 or more states, with existing data or where data can be collected during 2006. • A survey conducted by ADEM was used to integrate the R4 MPDC Pilot Project into each state’s baseline monitoring activities and to use existing data where available. Quality Control Measures Table 2. Quality control measures of specific steps in protocol to be calculated for each agency. Method Performance Documentation Form and Database • Data used to measure method performance will include at least: • 5 pairs of duplicate samples along stressor gradient • 10 reference reach samples within a site class • 10 “test” reach samples along a stressor gradient • Independent assessment of water quality at each site Level 3 and 4 Ecoregions of the southeastern US • We are developing forms for submitting bioassessment data to the state. • Entities will provide the following tables for reference, duplicate, and “test” sites: • 1. Site description • 2. Reference Reach Criteria • 3. Bioassessment data • 4. Ancillary data • An ACCESS database will be created to house all R4 method performance data, evaluate the data in terms of site class, sampling period, and overall dataset, and to calculate and report performance characteristics. Table 1. Summary of project areas, data sources, and joint bioassessments. If performance characteristics do not meet data quality requirements, this information may help each agency determine how they could potentially address the problem by identifying those steps that are most variable. If our assessments do differ, this information, in conjunction with the meta data associated with each of the reference and test samples, may help us determine why. 1) B: Bioregion; L3: Level 3 Ecoregion; L4: Level 4 Ecoregion; 2) Bioregion or L4 in which project will be focused; AA: All available; 3) Months for which macroinvertebrate bioassessment criteria developed; 4) E: existing data; 2006: data collected during 2006; 5) JB: Joint Bioassessments – 3-6 conducted at a gradient of good, fair, and poor sites.