Download
1 / 31
310 likes | 423 Views
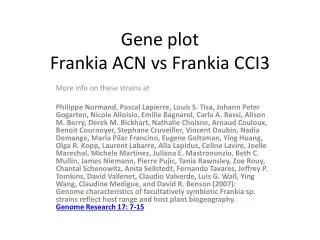
Gene plot Frankia ACN vs Frankia CCI3. More info on these strains at

E N D
Gene plotFrankia ACN vs Frankia CCI3 More info on these strains at Philippe Normand, Pascal Lapierre, Louis S. Tisa, Johann Peter Gogarten, Nicole Alloisio, Emilie Bagnarol, Carla A. Bassi, Alison M. Berry, Derek M. Bickhart, Nathalie Choisne, Arnaud Couloux, Benoit Cournoyer, Stephane Cruveiller, Vincent Daubin, Nadia Demange, Maria Pilar Francino, Eugene Goltsman, Ying Huang, Olga R. Kopp, Laurent Labarre, Alla Lapidus, Celine Lavire, Joelle Marechal, Michele Martinez, Juliana E. Mastronunzio, Beth C. Mullin, James Niemann, Pierre Pujic, Tania Rawnsley, Zoe Rouy, Chantal Schenowitz, Anita Sellstedt, Fernando Tavares, Jeffrey P. Tomkins, David Vallenet, Claudio Valverde, Luis G. Wall, Ying Wang, Claudine Medigue, and David R. Benson (2007):Genome characteristics of facultatively symbiotic Frankia sp. strains reflect host range and host plant biogeography.Genome Research 17: 7-15
Part of Perl script to keep only top scoring blast hit for each query
Part of the Frankia CCI3 ptt fileThis time in MSWord, with tabs set so it aligns nicely – note the non printing characters in blue
Add numbers to faa file –scriptRead table to hash $part[3] contains the GI number
Location of all blast hits in the two genomes and location of all top scoring blast hits in the two genomes E-value <10^-24:
Location of all blast hits in the two genomes and location of all top scoring blast hits in the two genomes E-value <10^-50:
Location of all blast hits in the two genomes and location of all top scoring blast hits in the two genomes E-value <10^-7:
Comparison between Thermotoga petrophila and Thermotoga maritima MSB8
Usually, *.fna files of bacterial genomes start with the origin of replication, and the direction is chosen so that the first encoded protein is DnaA (chromosomal replication initiator protein). Sometimes things go wrong. Cumulative Strand Bias HB27 Mummer Plot: HB27 versus SG0 Ori Should be here
Tetramer bias for Thermus thermophilus SG0 The same can be done with oligonucleotide bias (how often does an oligonucleotide occur on one strand minus occurrence on the other strand)
GC bias for Thermotoga maritima MSB8 http://www.sciencedirect.com/science/article/pii/S0168952599018946
Aeromonas_hydrophila_ATCC_7966_uid58617 versus Aeromonas_hydrophila_ML09_119_uid205540/ Evalue cut off: 10^-4
Aeromonas_hydrophila_ATCC_7966_uid58617 versus Aeromonas_hydrophila_ML09_119_uid205540/ E-value cut off: 10^-4 Top-scoring hits only
Aeromonas_hydrophila_ATCC_7966_uid58617 versus Aeromonas_hydrophila_ML09_119_uid205540/ Top scoring hit % identity versus position
Aeromonas_hydrophila_ATCC_7966_uid58617 versus Aeromonas_hydrophila_ML09_119_uid205540/ Top scoring hit bitscore per aa versus position
Aeromonas_hydrophila_ATCC_7966_uid58617 versus Aeromonas_hydrophila_ML09_119_uid205540/ Top scoring hit bitscore per aa versus position and log (E-value+10^-150)
Aeromonas_hydrophila_ATCC_7966_uid58617 versus Aeromonas_hydrophila_ML09_119_uid205540/ E-value cut off: 10^-4 Top-scoring hits only
Same with Gnuplot Aeromonas_hydrophila_ATCC_7966_uid58617 versus Aeromonas_hydrophila_ML09_119_uid205540/
Aeromonas_hydrophila_ML09_119_uid205540 versus Aeromonas_salmonicida A449
Aeromonas_hydrophila_ML09_119_uid205540 versus Aeromonas_veronii B565