Download
1 / 21
210 likes | 338 Views
Human-induced changes in the hydrological cycle of the western United States. Tim Barnett 1 , David Pierce 1 , Hugo Hildalgo 1 , Tapash Das 1 , Celine Bonfils 2 , Ben Santer 2 , G. Bala 2 , Art Mirin 2 , Andy Wood 4 , Toru Nozawa 3 , Dan Cayan 1 , Mike Dettinger 1

E N D
Human-induced changes in the hydrological cycle of the western United States Tim Barnett1, David Pierce1, Hugo Hildalgo1, Tapash Das1, Celine Bonfils2, Ben Santer2, G. Bala2, Art Mirin2, Andy Wood4, Toru Nozawa3, Dan Cayan1, Mike Dettinger1 1Scripps Institution of Oceanography 2Lawrence Livermore National Lab 3National Inst. Environmental Sciences (Japan) 4Univ. Washington
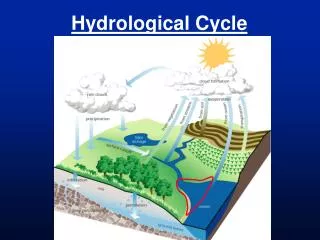
The hydrological cycle is changing • Examples of such changes are well documented: • Changes in snowfall & snow pack • e.g., Mote 2003; Mote et al. 2005; Knowles et al. 2006 • Changes in streamflow • e.g., Cayan et al. 2001; Stewart et al. 2005; Maurer et al. 2007 • Warmer air temperatures • e.g., Dettinger et al. 1995; Easterling 2002
The hydrological cycle is changing • Examples of such changes are well documented: • Changes in snowfall & snow pack • e.g., Mote 2003; Mote et al. 2005; Knowles et al. 2006 • Changes in streamflow • e.g., Cayan et al. 2001; Stewart et al. 2005; Maurer et al. 2007 • Warmer air temperatures • e.g., Dettinger et al. 1995; Easterling 2002 Can we say with confidence that these changes are due to human effects?
Detection and Attribution (D&A) • Detection: are the changes inconsistent with natural variability? • Attribution: are the changes consistent with anthropogenic forcing? • Generate a “fingerprint” that encapsulates changes expected (from model runs) • Assess trend in fingerprint in obs and models
Time series of key variables (obs.) All variables have been normalized (fractionalized) by dividing by the CCSM3-FV control run mean over first 300 yrs. Necessary for the multivariate detection and attribution (D&A), so have same variance in each variable (the “units problem”).
Novel aspects • Multivariate Detection and Attribution (D&A) • Not just temperature or streamflow alone • Regional • Have to address problems of large amplitude natural variability • Related to the hydrological cycle • Rare in formal D&A work • People can immediately relate to it
Overall scheme • Start with global GCMs: control and anthropogenically forced runs • Downscale and apply to region of interest • D&A on 3 variables: • SWE/P (1 April Snow Water Equv. / Oct-Mar precip) • Temperature (examined JFM frost days and degree days < 0) • River flow (examined JFM fraction, and fraction keyed to hydrograph)
Models and data • Control model GCM runs • 850 yrs CCSM3-FV (1.25Ox1O; finer resolution than T85) • 750 yrs PCM (T42) • Anthropogenically forced GCM runs, 1900-1999 • PCM (4 members) • MIROC (10 members – the “in progress” part!) • Regional statistical downscaling of GCM forcing • 2 methods, 12 km resolution • VIC hydrological model (1/8 deg resolution) • Observations, 1950-1999 • Snow courses for SWE • UW, Maurer, PRISM for T and P • Naturalized flow from Colorado R. (Lee’s Ferry), Columbia R. (Dalles), Sacramento and San Joaquin river
Questions • Are the changes due to warming or different amount of precipitation? • What do other models say?
P affecting SWE/P? Dividing by P removes majority of correlation between SWE and P
P affecting SWE/P? Dividing by P removes majority of correlation between SWE and P
P affecting SWE/P? Dividing by P removes majority of correlation between SWE and P Trend in P (blue) vs. SWE (red), 1950-1999 60% of stations show increasing P, but 71% show decreasing SWE
D&A figure for precipitation • Changes in precipitation over the west during the last 50 years did not cause the observed changes in the hydrological cycle
Comparison with MIROC SWE/P only!
Comparison with MIROC • Model estimated signal is weak • MIROC has less warming than obs 1950-99 as the aerosol cooling over the western U.S. is too strong • Matching the obs is a great metric for deciding which model(s) to believe. PCM is suggested in this special, limited regional case.
Conclusions • Much previous work noting changes in snow cover, temperature, and river flow over the western U.S., but no formal D&A, nor multivatiate • We have performed a formal multivariate detection and attribution analysis of SWE/P, JFM temperatures, and river flow • Pending complete MIROC results, appears that the changes in western hydrology over 1950-99 are largely human-induced (but see Hugo’s talk) • The PCM, run in forecast mode, shows a grim view of western U.S. water supplies within the next 30 years. If it worked so well over the last 50 years, we have good reason to believe these predictions