Download
1 / 44
440 likes | 679 Views
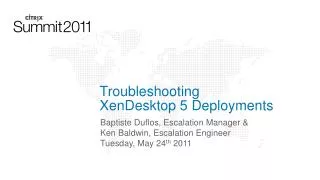
Optimizing XenServer Deployments to Best Support XenDesktop. Daniel Lazar. Senior Escalation Engineer. May 8, 2012. Tweet about this session with hashtag #SUM302 and #CitrixSummit. Agenda. XenServer and XenDesktop Interoperability Overview Monitoring XenServer to Identify Problems

E N D
Optimizing XenServer Deployments to Best Support XenDesktop Daniel Lazar Senior Escalation Engineer May 8, 2012
Tweet about this session with hashtag #SUM302 and #CitrixSummit
Agenda • XenServer and XenDesktop Interoperability Overview • Monitoring XenServer to Identify Problems • Best Practices and Troubleshooting • Resources • Questions
Interoperability Overview Desktop Controller Resource Pool Connection to XAPI on pool master via HTTP port 80 Hypervisor Communication Library (HCL) Hosting Management Pool Master VDA Management Slaves Windows Communication Foundation (WCF) Shared Storage Virtual Desktops running Receiver Active Directory Database (SQLServer) 1011011010 10001 1011011010 1011011010 10110 1011011010 1001 011010 1011011010 101011011101101110 11
Interoperability Overview How do large-scale XenDesktop implementations impact XenServer? Large number of concurrently running VMs-per-host. Boot/Reboot Storms PVS/IntelliCache can add storage management overhead The XAPI task queue
Monitoring XenServer to Identify Problems Online Monitoring Load Average • # top XAPI Task Queue • # xe task-list General storage and network monitoring • # iostat, hdparm, dd • # tcpdump, netstat, ifconfig
Monitoring XenServer to Identify Problems Online Monitoring – Load Average Use ‘top’ to get real-time information relating to load top - 13:35:11 up 2 days, 19:02, 4 users, load average: 36.27, 23.64, 14.73 Tasks: 435 total, 27 running, 408 sleeping, 0 stopped, 0 zombie Cpu0 : 13.6%us, 60.5%sy, 0.0%ni, 4.7%id, 18.4%wa, 0.0%hi, 0.0%si, 2.5%st Cpu1 : 14.2%us, 60.4%sy, 0.0%ni, 2.8%id, 19.9%wa, 0.0%hi, 0.0%si, 2.4%st Cpu2 : 13.0%us, 60.7%sy, 0.0%ni, 4.6%id, 18.9%wa, 0.0%hi, 0.0%si, 2.5%st Cpu3 : 13.3%us, 60.4%sy, 0.0%ni, 6.1%id, 17.5%wa, 0.0%hi, 0.0%si, 2.5%st Mem: 771328k total, 749068k used, 22260k free, 20388k buffers Swap: 524280k total, 85720k used, 438560k free, 161512k cached PID USER PR NI VIRT RES SHR S %CPU %MEM TIME+ COMMAND 8722 root 20 0 857m 46m 4320 S 70.5 6.1 134:09.34 xapi 6974 65764 20 0 31336 4492 1372 R 19.3 0.6 0:12.56 qemu-dm 3632 65757 20 0 32744 3728 1292 R 11.5 0.5 0:48.05 qemu-dm 4576 65759 20 0 31656 4100 1320 R 10.5 0.5 0:38.39 qemu-dm 1835 65753 20 0 33000 3644 1276 R 10.2 0.5 1:12.09 qemu-dm 1398 65752 20 0 32872 3692 1252 R 9.8 0.5 1:21.79 qemu-dm 15-Minute Avg 5-Minute Avg 1-Minute Avg
Monitoring XenServer to Identify Problems Online Monitoring – Task Queue You can count the number of running tasks: # xe task-list | grep ‘VM.<type>’ | wc –l Example task types could be start, shutdown or migrate. Try to tune the XenDesktop Controller to minimize the number of tasks concurrently being processed on the pool master.
Monitoring XenServer to Identify Problems Online Monitoring – Storage # iostat # Reports basic I/O stats for devices and partitions # hdparm # Performs timed sequential reads # dd # Simple, common block device copy utility See CTX125178 for more information on how to monitor storage in XenServer.
Monitoring XenServer to Identify Problems Online Monitoring – Network # tcpdump # Dumps traffic on a network # netstat # Display network interface statistics # ifconfig # Display and configure network interfaces See CTX129669 for more information on monitoring the network in XenServer TIP: You can always type ‘man’ followed by a Linux command name (i.e., ‘man netstat’) to get detailed help for the command.
Monitoring XenServer to Identify Problems Offline Monitoring – System Logs System Status Reports • XAPI Connection Limit Exceeded • Tools as a Service (TaaS) System Activity Reporting (SAR) – Part of the CentOS base
Monitoring XenServer to Identify Problems Status reports available via XenCenter, or... the command line by running ‘# xen-bugtool –yestoall’ See CTX125372 for detailed instructions.
Monitoring XenServer to Identify Problems Offline Monitoring – XAPI Connection Limit XAPI and the control domain (Dom0) can only maintain 200 concurrent connections (per-host). Limit can be reached more easily in XenDesktop environments because the number of tasks being queued on the pool master will often be high. Can parse /var/log/xensource.log* for "db_gc] Session.destroy“ to give an indication of whether connection limits are being met. A simple bash script can do this quickly: #!/bin/bash LIST="$(find -name xensource.lo*)" for i in "$LIST"; do grep -h "db_gc] Session.destroy" $i done
Monitoring XenServer to Identify Problems Offline Monitoring – SAR Logs Located under /var/log/sa They are NOT included in the host system status report and therefore need to be collected manually for analysis: # tar -cvzf /tmp/$HOSTNAME-$(date +%F-%H-%M-%S)-SARlogs.tar.gz /var/log/sa/* Can give a historical picture of average load on the host and indicate when and if there are periods of high load in the environment.
Monitoring XenServer to Identify Problems Offline Monitoring – SAR Logs 00:00:01 runq-sz plist-sz ldavg-1 ldavg-5 ldavg-15 13:10:01 13 740 7.11 4.46 1.85 13:20:03 15 846 9.49 8.09 4.88 13:30:03 92 917 32.10 18.64 10.66 13:40:10 82 949 14.71 20.48 16.15 13:50:09 13 1005 35.73 27.75 20.91 14:00:03 133 1040 72.92 63.73 42.05 14:10:06 72 1084 83.21 79.05 59.89 14:20:09 5 1094 88.50 86.03 71.52 TIP: Third-party tools are available to graph and analyze SAR data files!
Monitoring XenServer to Identify Problems VHD link dependencies with PVS amd IntelliCache Provisioning Services (PVS) and IntelliCache leverage disk fast-cloning to quickly provision many virtual desktops. Fast-clones create new VDIs which are linked in parent-child relationships. Large XenDesktop environments can create many of these links, and this can cause issues….
Parent VDI (Base Copy) Storage Repository (SR) Child VDI (fast-clone/diff-disk) VDA001-diff VDI VDA002-diff PBD VBD XenServer Host Virtual Machine VDA003-diff . . VDAxxx-diff
Monitoring XenServer to Identify Problems MCS/PVS – Why might this be a problem? MCS profile creation and management can take a very long time, or fail completely. Host storage operations can be affected. Can cause poor performance, or even instability and XenServer host crashes!
Monitoring XenServer to Identify Problems • Uploading a status report from the pool to TaaS can give a good graphical representation of the VDI link dependencies • taas.citrix.com
Monitoring XenServer to Identify Problems MCS/PVS – How to Monitor For LVM-based storage: • # vhd-util scan -f -c -p -m 'VHD-*' -l VG_XenStorage-<SR UUID> For NFS-based storage: • # vhd-util scan -f -c -p -m /var/run/sr-mount/<SR UUID>/*.vhd # vhd-util scan -f -c -p -m -v 'VHD-*' -l VG_XenStorage-8021d7b1-0b4d-03ff-d461-4553ef6eaf01 vhd=VHD-759d484d-2bc9-44c2-8d40-c84a0408602b hidden=1 parent=none vhd=VHD-172396a5-bd42-4d89-a172-a31387ed1c7a hidden=0 parent=VHD-759d484d-2bc9-44c2-... vhd=VHD-1daf350c-2631-4fb3-8203-5500d6489363 hidden=0 parent=VHD-759d484d-2bc9-44c2-... vhd=VHD-60607534-4c7d-4b03-a950-095dfb2e5f67 hidden=0 parent=VHD-759d484d-2bc9-44c2-... vhd=... Child VDIs (diff disks) Parent VDI (base copy)
Monitoring XenServer to Identify Problems MCS/PVS – How to Monitor Check ‘tapdisk2’ process utilization top - 13:35:11 up 2 days, 19:02, 4 users, load average: 36.27, 23.64, 14.73 Tasks: 435 total, 27 running, 408 sleeping, 0 stopped, 0 zombie Cpu(s): 15.2%us, 67.2%sy, 0.0%ni, 3.1%id, 10.1%wa, 0.0%hi, 1.8%si, 2.7%st Mem: 771328k total, 749068k used, 22260k free, 20388k buffers Swap: 524280k total, 85720k used, 438560k free, 161512k cached PID USER PR NI VIRT RES SHR S %CPU %MEM TIME+ COMMAND 8722 root 20 0 857m 46m 4320 S 55.5 6.1 134:09.34 xapi 20438 root 20 0 3664 2256 1868 S 23.3 0.5 0:00.24 tapdisk2 20571 root 20 0 3976 2568 1904 S 20.8 0.5 0:02.19 tapdisk2 ...
Monitoring XenServer to Identify Problems MCS/PVS – How to Monitor 00:00:01 CPU %user %nice %system %iowait %steal %idle 00:10:01 all 1.05 0.00 0.17 0.04 0.02 98.72 00:10:01 0 1.43 0.00 0.15 0.09 0.03 98.30 00:10:01 1 1.25 0.00 0.23 0.01 0.01 98.49 ... 19:10:01 all 4.77 0.00 19.87 36.10 1.25 38.01 19:10:01 0 4.70 0.00 18.42 34.41 1.29 41.18 19:10:01 1 5.02 0.00 20.41 31.88 1.25 41.44 19:10:01 2 4.88 0.00 20.52 40.98 1.29 32.34 19:10:01 3 4.50 0.00 20.12 37.11 1.19 37.09
Monitoring XenServer to Identify Problems MCS/PVS – How to Monitor For extended monitoring, performance capture scripts can also be deployed on the XenServers to collect process and memory utilization statistics over time. For more information see CTX128714 and CTX128724.
Best Practices and Troubleshooting Tweaking XenServer Increase Dom0 memory allocation • See CTX126531 for instructions. Limit the number of hosts in the pool, or create multiple pools Optimize shared storage for PVS or IntelliCache • See CTX130632 for more information. Ensure XenServer and XenDesktop are at compatible versions and have all critical hotfixes and updates applied.
Best Practices and Troubleshooting Tweaking XenDesktop Max active actions Max new actions per minute Max power actions as percentage of desktops
Best Practices and Troubleshooting Tweaking XenDesktop (continued) Power Management and idle pool configuration.
Best Practices and Troubleshooting Decoupling VDIs When the VHD chains get too long, the VDIs need to be decoupled, i.e., fully copied to remove the parent-child links. Can be tedious and time-consuming. Contact Citrix Technical Support for expert assistance!
Best Practices and Troubleshooting General Storage and Network Troubleshooting When using NFS monitor for connection drops with the storage: # grep 'kernel: nfs: server [0-9.]* not responding, timed out' /var/log/messages Try to isolate storage, VM and host management network traffic. Ensure all the virtual desktops can communicate directly with the XenDesktop Controller.
Best Practices and Troubleshooting Other Common Issues Virtual desktops disconnect or hang when connecting • Check the virtual desktop to see if 3rd-party apps are interfering with logins • Confirm the virtual desktop is not having issues communicating with the XenDesktop Controller. • Ensure there are no GPOs or other Active Directory policies enabled on the virtual desktops that would interfere with logon/logoff behavior.
Best Practices and Troubleshooting Other Common Issues VMs fail to register in Desktop Studio • Make sure the VMs are booting up OK and the XenServer hosts are not under heavy load preventing the VMs from operating normally. • Also might be due to communication issues between the virtual desktops and the XenDesktop Controller—ensure there is network connectivity between them. • Make sure DNS is configured correctly in the environment.
Best Practices and Troubleshooting Other Common Issues XenServer pool master crashes or becomes unresponsive • Ensure there are not too many VMs running on the master. Offloading VMs to the slaves and/or placing desktop groups into maintenance mode can mitigate this in the short-term. • Monitor the load average in the pool and confirm that the master is not overburdened with specific tasks, such as storage management or XAPI task management. • Check for long VHD chains. • In large pools this could indicate the need to split the pool to decrease load on the pool master.
Best Practices and Troubleshooting Other Common Issues Takes a long time for all the virtual desktops to boot and register with the Desktop Controller • Check the Advanced Host Configuration in the Desktop Studio and compare to the XAPI task queue and master load average to determine if the XenDesktop Controller is sending too many tasks at once. • Check the idle pool settings to determine if the pool is trying to maintain too high of an idle pool count, and if so reduce the idle pool count to bring the pool into balance. • Issues with registration which relate to load in large pools might also indicate the need to split the pool into multiple smaller pools.
Resources Monitoring and Troubleshooting CTX131339 - XenServer performance: reality and myths CTX128724 - Memco.sh - Memory Data Collection Script for XenServer Dom0 or Linux Systems CTX128714 - Perfco.sh - Performance Data Collection Script for XenServer Dom0 CTX126986 - Troubleshooting XenServer Deployments CTX125180 - Troubleshooting XenDesktop, Provisioning Services & XenServer Integration
Resources Storage and Networking CTX125178 - XenServer Storage Management and Troubleshooting CTX118397 - Introduction to Storage Technologies CTX129669 - Overview of XenServer Distributed Virtual Switch/Controller and Troubleshooting Network Issues CTX128502 - Introduction to XenServer Networking CTX130632 - XenDesktop Planning Guide - Storage Best Practices
Resources Configuration and Reference CTX130420 - XenServer 6.0 Administrator's Guide CTX132110 - XenDesktop Planning Guide – XenServer Integration CTX125372 - How to Collect Diagnostic Information for Citrix XenServer CTX126531 - How to Configure Dom0 Memory in XenServer 5.6 or later
http://Taas.Citrix.com/Beta Find out how to rev up environment maintenance See your Citrix pit crew in the expo hall with the Tools as a Service checkered racing shoes
We value your feedback! Take a survey of this session now in the mobile app Click 'Sessions' button Click on today's tab Find this session Click 'Surveys'
Before you leave… • Conference surveys are available online at www.citrixsummit.com starting Thursday, May 10 • Provide your feedback and pick up a complimentary gift at the registration desk • Download presentations starting Monday, May 21, from your My Organizer tool located in your My Account