Download
1 / 25
250 likes | 395 Views
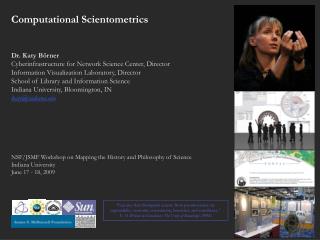
The Scholarly Database and Its Utility for Scientometrics Research Dr. Katy Börner Cyberinfrastructure for Network Science Center, Director Information Visualization Laboratory, Director School of Library and Information Science Indiana University, Bloomington, IN katy@indiana.edu

E N D
The Scholarly Database and Its Utility for Scientometrics Research Dr. Katy Börner Cyberinfrastructure for Network Science Center, Director Information Visualization Laboratory, Director School of Library and Information Science Indiana University, Bloomington, IN katy@indiana.edu Co-Authors are Gavin LaRowe, Sumeet Ambre, John Burgoon & Weimao Ke Cyberinfrastructure for Network Science Center ISI 2007, Madrid, Spain June 26, 2007
This Talk has Three Parts: • Motivation • Scholarly Database • Discussion and Outlook 2
This Talk has Three Parts: • Motivation • Scholarly Database • Discussion and Outlook 3
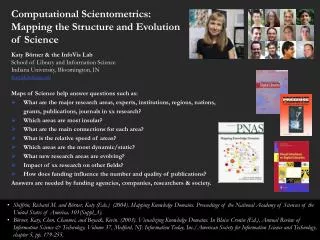
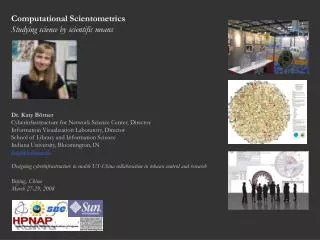
Computational Scientometrics: • Studying Science by Scientific Means • Börner, Katy, Chen, Chaomei, and Boyack, Kevin. (2003). Visualizing Knowledge Domains. In Blaise Cronin (Ed.), Annual Review of Information Science & Technology, Medford, NJ: Information Today, Inc./American Society for Information Science and Technology, Volume 37, Chapter 5, pp. 179-255. • Shiffrin, Richard M. and Börner, Katy (Eds.) (2004). Mapping Knowledge Domains. Proceedings of the National Academy of Sciences of the United States of America, 101(Suppl_1). • Börner, Katy, Sanyal, Soma and Vespignani, Alessandro (in press). Network Science. In Blaise Cronin (Ed.), Annual Review of Information Science & Technology, Information Today, Inc./American Society for Information Science and Technology, Medford, NJ, Volume 41, Chapter 12, pp. 537-607. • Places & Spaces: Mapping Science exhibit, see also http://scimaps.org. 4
Places & Spaces: Mapping Science a science exhibit that introduces people to maps of sciences, their makers and users. http://scimaps.org Exhibit Curators: Dr. Katy Börner & Julie Smith, Indiana University 5
Places & Spaces: Mapping Science exhibit, see also http://scimaps.org.
This Talk has Three Parts: • Motivation • Scholarly Database • Discussion and Outlook 8
Challenges - Interlink $ Input & Publication/Patent Citation Output Need to interlink • Grants and papers/patents. • Grants/papers/patents and their PIs/authors/inventors, etc. Use resulting networks to • Count #papers, #citations, etc. • Determine strength of co-PI/author/inventor relations, etc. Katy Börner, The Scholarly Database and Its Utility for Scientometrics Research
Scholarly Database: Web Interface Search across publications, patents, grants. Download records and/or (evolving) co-author, paper-citation networks. Register for free access at https://sdb.slis.indiana.edu. Katy Börner, The Scholarly Database and Its Utility for Scientometrics Research
Scholarly Database: # Records & Years Covered Datasets available via the Scholarly Database (* future feature) Aim for comprehensive time, geospatial, and topic coverage. Katy Börner, The Scholarly Database and Its Utility for Scientometrics Research
This Talk has Three Parts: • Motivation • Scholarly Database • Discussion and Outlook 17
CAREER: Visualizing Knowledge Domains. NSF IIS-0238261 award (Katy Börner, $440,000) Sept. 03-Aug. 08. http://iv.slis.indiana.edu/ SEI: Network Workbench: A Large-Scale Network Analysis, Modeling and Visualization Toolkit for Biomedical, Social Science and Physics Research. NSF IIS-0513650 award (Katy Börner, Albert-Laszlo Barabasi, Santiago Schnell, Alessandro Vespignani & Stanley Wasserman, Craig Stewart (Senior Personnel), $1,120,926) Sept. 05 - Aug. 08. http://nwb.slis.indiana.edu 18
The Future: Science (Forecast) Maps Online There is a need to • Understand the inner workings of science in order to support scientific progress and innovation. • To monitor and support science as an dynamic system that changes quantitatively and qualitatively over time. • To bridge between industry and academia to support the development of ideas into products. • To communicate the results of science and technology to anybody for educational purposes but also to justify expenditures. Only high quality data will lead to high quality maps and insights. Hence, there is a need to harvest higher coverage (international and interdisciplinary) data, to clean data, and to interlink data types. This can only be achieved in a collective effort similar to Wikipedia. Katy Börner, The Scholarly Database and Its Utility for Scientometrics Research
The Future: Science (Forecast) Maps Online • Needed is a ‘marketplace’ of scholarly data, algorithms, services, expertise, publications. • Maps of science can serve as a visual interface to these scholarly data types. • Maps can be served in a Google Maps like fashion with wikipedia functionality, i.e., anybody can add data, comment on data, rate resources similar to Flickr or YouTube. Incentive Design • Many people will like to see themselves on the map providing incentives for them to help add and clean data. • If funding agencies use these maps to see the impact of scholars as well as their work context then another major incentive is created. • If industry uses these maps to enlist needed technologies and available funding opportunities then a 3rd incentive for being on the map is created. Katy Börner, The Scholarly Database and Its Utility for Scientometrics Research
The Power of MapsFour Early Maps of Our World VERSUS Six Early Maps of Science(1st Iteration of Places & Spaces Exhibit - 2005)
The Power of Reference SystemsFour Existing Reference Systems VERSUS Six Potential Reference Systems of Science(2nd Iteration of Places & Spaces Exhibit - 2006)
The Power of ForecastsFour Existing Forecasts VERSUS Six Potential Science ‘Weather’ Forecasts(3rd Iteration of Places & Spaces Exhibit - 2007) ? ? ? ? ? ? ? ? ? ?
I would like to thank all my colleagues and collaborators. SLIS If not otherwise indicated, this work was conducted at the Information Visualization Laboratory and the Cyberinfrastructure for Network Science Center at Indiana University. Science Map layout by Dick Klavans and Kevin Boyack