Download
1 / 15
150 likes | 155 Views
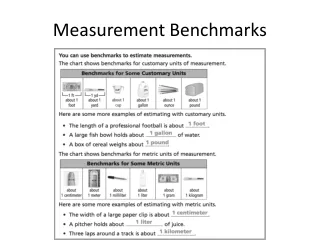
Historical Benchmarks. HRT 383 Lunch & Dinner Fall 2006. What is a benchmark?. From Merriam-Webster Online: A point of reference from which measurements may be made http://www.m-w.com/cgi-bin/dictionary Accessed 10/08/04. An Historical Benchmark is…. An historical point of reference

E N D
Historical Benchmarks HRT 383 Lunch & Dinner Fall 2006
What is a benchmark? • From Merriam-Webster Online: A point of reference from which measurements may be made http://www.m-w.com/cgi-bin/dictionary Accessed 10/08/04
An Historical Benchmark is… • An historical point of reference • What did we do in the past? • Measurable • Dollars/Cents • Percentage • Count • Time • Weight • Volume
Cautions: • Compare “Apples to Apples” • Watch for differences in: • Volume • Days or Day-Part Variations • Number of operation periods • Hours of operation • Seasonality • “Like Items” • Menu prices • A La Carte vs. Banquets
Searching for Benchmarks… • Net Sales Analysis: • Daily or weekly sales in dollars • Total sales • Food sales • Beer sales • Wine sales • Bar sales • Daily or weekly guest count • Daily or weekly check average
Searching for Benchmarks… • Weekly Menu Mix/Sales History Analysis: • Item sales (by count or percentage) • Individual items (count or percent) • Category sales (count or percentage) • A la carte counts vs. banquet counts • Unless most other measures are equal (or close to equal), use percentages for benchmarks!
Searching for Benchmarks… • Bar Cost: • Daily or weekly percentages • Beer costs percentage • Wine cost percentage • Total bar percentage • Usually, weekly information is more accurate than daily information
Searching for Benchmarks… • Credits to Cost of Goods Sold: • Comps vs. Total Sales • Goodwill comps (marketing) vs. QSA • Waste report • Accuracy is critical • Use for information rather than benchmarks • Family meal issues
Searching for Benchmarks… • Weekly Summary: • QTD information • Counts • Check average • Sales • COGS • Quarterly food cost percentage • Weekly and quarterly bar cost percentage • Other expense categories by percentage
Searching for Benchmarks… • QTD Menu Mix/Sales History Analysis: • Item sales (by count or percentage) • Individual items (count or percent) • Category sales (count or percentage) • A la carte counts vs. banquet counts • Usually QTD information is used for benchmark percentages
Searching for Benchmarks… • Budgets: • Total Sales • COGS • Food cost percentage target is 50% • Bar cost percentage target is 40%
Searching for Benchmarks… • Lunch Menu Mix –2006: • Appetizers 45.8% • Manager’s Special App 26.3% • #1-Selling Menu Entrée – RKR Burger 12.4% • Salmon 12% • Turkado 11.5% • Manager’s Special Entrée 27.1% • A la carte to banquet = 76.3% / 23.7% • Desserts = 46.3% • Manager’s Special Dessert 26.1% • Beverages = 76.9%
Weekly Bar Sales 198 4.6% Food sales 4,109 95.4% Total Sales 4,306 Daily Bar Sales 40 4.6% Food sales 822 95.4% Total Sales 862 60 Covers/day @ $14.- Lunch Projection
Searching for Benchmarks… • Dinner Menu Mix –2006: • Appetizers 58.1% • #1-Sirloin 33.2% • #2-Lamb 15.2% • #3-Salmon12.3% • A la carte to banquet 79.6 / 20.4% • Desserts 60.3% • Beverages 93% • Bottled Wine 262 each • WBTG 362 each
Weekly Bar Sales 1,163 23% Food sales 3,893 77% Total Sales 5,055 Daily Bar Sales 388 23% Food sales 1,298 77% Total Sales 1,686 50 Covers/day @ $34.- Dinner Projection