Download
1 / 62
620 likes | 771 Views
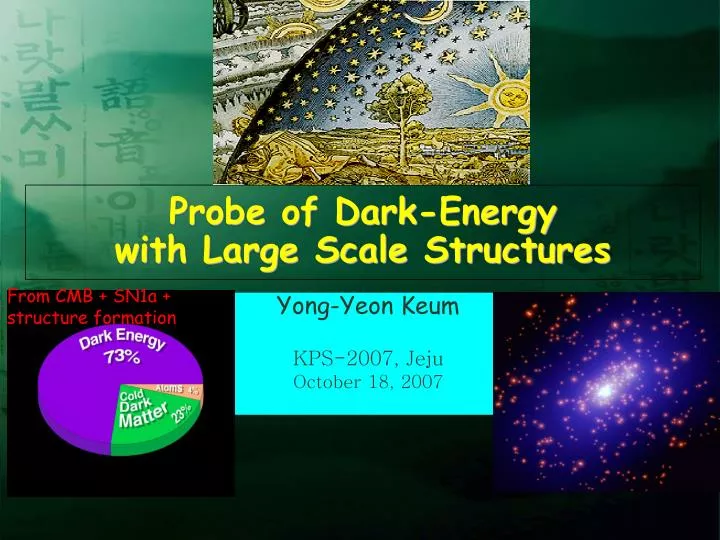
Yong-Yeon Keum KPS-2007, Jeju October 18, 2007. From CMB + SN1a + structure formation. Probe of Dark-Energy with Large Scale Structures. Experimental evidences of accelerating universe Candidates of Dark Energy Probe of Dark-Energy with Large Scale Structures Summary. Contents.

E N D
Yong-Yeon Keum KPS-2007, Jeju October 18, 2007 From CMB + SN1a + structure formation Probe of Dark-Energy with Large Scale Structures
Experimental evidences of accelerating universe • Candidates of Dark Energy • Probe of Dark-Energy with Large Scale Structures • Summary Contents
ASTRONOMY: Cosmic Motion Revealed Breakthrough of 1998: the Winner
Illuminating the Dark Universe Breakthrough of 2003: the Winner
Our understanding of Matter budget of the cosmos Fig:NASA/WMAP science team
CMB AT A GIVEN DISTANCE Known physical sizeangledepends on geometry Known luminosityfluxdepends on geometry SN Ia Measurement of the geometry Closed Universe Flat Universe Open Universe
H0DL cz measure of H0 Large z : measure of m, z 0 1+z = a(tobs)/a(tem) At a given z m = - 2.5 log F + cst = 5 log (H0DL) + M - 5 log H0 + 25 Hubble diagram: Accelerated expansion = smaller rate in the past = more time to reach a given z = larger distance of propagation of the photons = smaller flux fainter Supernova Cosmology Project Magnitude m older Redshift z
evolution of Hubble -parameter k G 8 ¼ 2 ( ) ( ) ( ) ( ) H 1 t t t t + + + + ½ = = h k X t t o m p 2 3 a 0 0 0 0 1 + + + = h k X m p ( ) H t ( ) = 0 3 0 4 0 3 1 0 2 1 2 ¡ ¡ ¡ + ¡ [ ] w + + + a a a a = h k X m p H 0 Define: We have a(0)/a(t)=1+z, a(0)=1
( ) 0 3 1 + P ( ) ( ) w 1 1 3 i + + w z i i i ( ) 1 ¡ q z = ( ) 0 P ( ) 3 1 + 2 1 w + i z 0 0 0 i i 0 0 0 3 0 7 ' = = = k ¤ ; ; : ; : r m 1 ¡ w = ¤ 0 3 ( ) 3 1 + z ( ) m 1 ¡ q z = 0 ( ) 0 3 2 1 + + z ¤ m ( ) 0 < q z = 1 3 0 ½ ¾ 2 ¤ 1 ¡ < z z = c 0 m 0 7 z = c : accelerating expansion epoch
Accidental First Prove G.Gamov’s HBB Theory: His estimation is ~5 0K Discovered in 1965 as “excess noise” (Nobble Prize in 1978) Discovery of CMBR 25 years later Bell Labs COBE 1992 Bell Labs Wilson Penzias (+ Robert Dicke,Peebles) The First (unrecognized) Direct measurement of CMBR: T.Shmaonov and Pulkovo in 1955; 3.5 0K CMB = 25 % of TV noise
Galaxies, clusters CMB observable observable Density perturbations (inflation?) t = 10-35 s Nucleosynthesis t ~ 1 mn Back to thermal history t ~ 380000 yrs Recombination: p+e- H+g Matter: Gravitational collapse Photons: Free propagation
John C Mather COBE Satellite In 1990-1992 The search begins .... Nobel Prize in physics 2006 George F Smoot
COBE-DMR Discovery, 1992 Milestones of CMB Cosmology The microwave sky image from WMAP Mission, 2003 & 2006 Planck Surveyor resolution, anticipated 2011
Acoustic oscillations 3 regimes of CMB power spectrum Damping tail Large scale plateau
Limited by causality (remember?) maximum scale Max. scale of anisotropies Max scale relates to total content of Universe Wtot
What we know so far From SNIa and CMB radiation observations, • Our universe is almost flat, now accelerating. • The dominance of a dark energy component with negative pressure in the present era is responsible for the universe’s accelerated expansion.
1 0 0 3 ' ' ¡ k q m = ¤ : 0 m 2 1 + ' ¤ m Hubble relation (luminosity distance) angular diameter distance power spectrum of mass perturbations (growth-redshift)
Einstein Equation geometric structure matter distribution Perfect fluid – the zeroth-order approximation : energy density P : pressure : functions of time
Einstein’s General Relativity (GR) & Cosmological Principle (CP): Our Universe: Homogeneous and Isotropic (00): (1) (2) (i i): (3) Supernova Cosmology Projects (1999): or Quintessence (“Dark Energy”) Negative Pressure
Candidates of Dark Energy • Cosmological Constant • Dynamical Cosmological constant (Time-dependent; Quintessence ) - quintessence: potential term + canonical kinetic term - K-essence: non-canonical kinetic term - phantom - quintom -Tachyon field • Modified Gravity (MFE)
( ) ( ) ( ) p a w a ½ a = X X ( ) ( ) 1 + ¡ w a w a w = 0 a 0 w w 0 X a ; ; detection of dark energy three parameters
Classification of Dark-Energy Modelsvia equation of states (w) • We redefine two parameter space of observables: -1.38<w<-0.82 (2s) w = P/r
Search for the origin of Dark-Energywith Large Scale Structures • Baryon Acoustic Oscillation (BAO) • Galaxy Cluster surveys (GL) • Supernova type Ia surveys (SNIa) • Weak Lensing surveys (WL)
( ) H a R a ( ( ) ) = = d 0 3 0 4 0 3 1 0 2 1 2 ¡ ¡ ¡ + ¡ ; ; ; [ ] a w a a + + + 1 a a e a = k X m r H 0 ways to measure dark energy • luminosity distance-redshift relation: • angular distance-redshift relation: • volume-redshift relation: • linear growth-redshift relation:
which samples we need standrad candle: same luminosity standard ruler: same linear size standrad uniform samples: # of samples standrad linear structures
0 ' v s 2 H 3 0 m H G Ä _ 2 4 + g g ¼ ½ g g = = m 3 2 a ( ) g z growth factor– redshift relation(linear regime) The amplitude of matter fluctuations provides an additional observables manifestation of Dark energy via the growth-redshift relation g(z)
EX: Distinguishing the w=-0.9 model from LCDM requires percent-level precision
Analysis of the four techniques: • Questions of what kind of Strength vs Weakness in each method?
( ) ( ) d z g z A ; weak lensing
Cosmological weak lensing • Arises from total matter clustering • Note affected by galaxy bias uncertainty • Well modeled based on simulations (current accuracy <10%, White & Vale 04) • Tiny 1-2% level effect • Intrinsic ellipticity per galaxy, ~30% • Needs numerous number (10^8) of galaxies for the precise measurement z=zs past Large-scale structure z=zl z=0 present
Z ( ) ( ) ( ) f » » d » K x x g = ; cosmic shear The cosmic shear is a tiny gravitational distortion to the shapes of galaxies. The shear power spectrum measures the potential fluctuations of the intervening cosmic field. The lensing kernel is geometric. Littman et al. (2000)
cosmic shear the shear correlation originates from the correlation of the foreground mass. the cosmic shear, i.e., weak lensing signal, is much weaker.
Deformation Matrix: Shear (shape distortion) Convergence (isotropic area distortion) A CDM hierachical structure induces coherent shear pattern: -Cosmological scale > 10 Mpc: a few percent -Cluster scale < a few Mpc: ~ O(0.1)
WL Sensitive to Cosmology for a source galaxy at a certain zs (zs~1) • Geometric test of DE: lensing efficiency • Overall amplitude is sensitive to m, i.e. DE if a flat universe is “a prior” assumed • Sensitive to H(z) through DA, i.e. DE • Depends on source redshifts – uncertainty in WL measurements if redshift info is not available • Structure formation test of DE: mass clustering, • Described by matter P(k; z) (cf. Peacock & Dodds 96; Smith et al. 03) • which is sensitive to primordial P(k) and growth rate, G(a) • Time evolution of G(a) is sensitive to DE
Weak Lensing Tomography Hu 99; Huterer 02; Refregier et al. 03; Takada & Jain 04 zlens1 zlens2 z1 lensing matter z2 Less DE • Shear @ z=z1 & z2 is given by integral of growth function G(a) & distances DA over the matter distribution, d(a) • Lensing tomography probes expansion kinematics H(a) and growth of structure g(a)
Weak Lensing Tomography- Method • Subdivide source galaxies into several bins based on photo-z derived from multi-color imaging • <zi> in each bin needs accuracy of ~0.1% • Adds some ``depth’’ information to lensing – improve cosmological parameters (including DE).
Weak Gravitational Lensing(WL) [D(z), g(z)] • Strengths: • the greatest potential for constraining dark-energy • The multitude of WL statistics (power spectra, cross-spectra, bispectra, etc) allows internal tests for, and correction of, many potential systematic errors. -WL surveys produces shear-selected galaxy-cluster counts and photo-z BAO data without any additional cost. • Weakness: • WL is likely to be limited by systematic errors arising from incomplete knowledge of the error distributions of photometric redshifts. - The methodology of WL is progressing rapidly but not yet matured.
Ä 2 2 k £ £ 0 + v = s ½ m R = ½ r ( ) ( ) k £ A t t c o s v = s From T_eq to recombination epoch Baryon Acoustic Oscillations (BAO) - hydrogen ionized - free electrons glue photon to baryons - photon-baryon fluid - gravitation is dominated by dark matter
BAO as a standard ruler Angular diameter distance & Hubble parameter + RS~150 Mpc (Sound horizon at recombination) (Angular & radial scales) RS = cDz/H = DqD
Baryon Acoustic Oscillations SDSS LRGs Eisenstein et al (2005) spatial correlations of galaxies vs. redshift (Baryon Acoustic Oscillations, BAO) utilizes the “standard ruler” of the peak in the correlation of dark matter revealed in the temperature anisotropies in the cosmic microwave background (CMB).
Baryon Acoustic Oscillations [D(z), H(z)] • Strength: - constrain D(z) and H(z) at high z, - least affected by systematic uncertainties -- if dark-energy is more prominent at high-z than in LCDM model, then high-z measures of D(z) and H(z) become useful for dark-energy constraints. • Weakness: -- the least statistical power to detect departure from LCDM model within the (w_0,w_a) parameterization, since the most precise measurements are made at z>1, where DE is relatively unimportant if DE approximates a cosmological constant.
p ( ) ( = ) d d L F 1 4 + r z ¼ z = = L L supernova Ia luminosity distance-redshift relation standard candle collapse of white dwarf Chandrasekhar limit 1.4 solar mass low-z SNe are needed. SN constraints on dark energy equation of state parameters are sensitive to the mean curvature. subject to evolutional uncertainties
NOW SNAP (Supernova/Acceleration Probe) SN Ia SNAP
Supernovae(SN) [D(z)] • Strength: the most well established method and currently contributes the most to the constraint of dark-energy. • Weakness: • Changes in the population of type Ia events. • Foreground extinction over time will bias dark-energy parameters unless they can be identified by signatures in the colors/spectra/light curves of the individual events • Estimates of the systematic errors are very difficult in the absence of a quantitative understanding of the diversity of SN events and their foreground extinction.