Download
1 / 99
990 likes | 1.15k Views
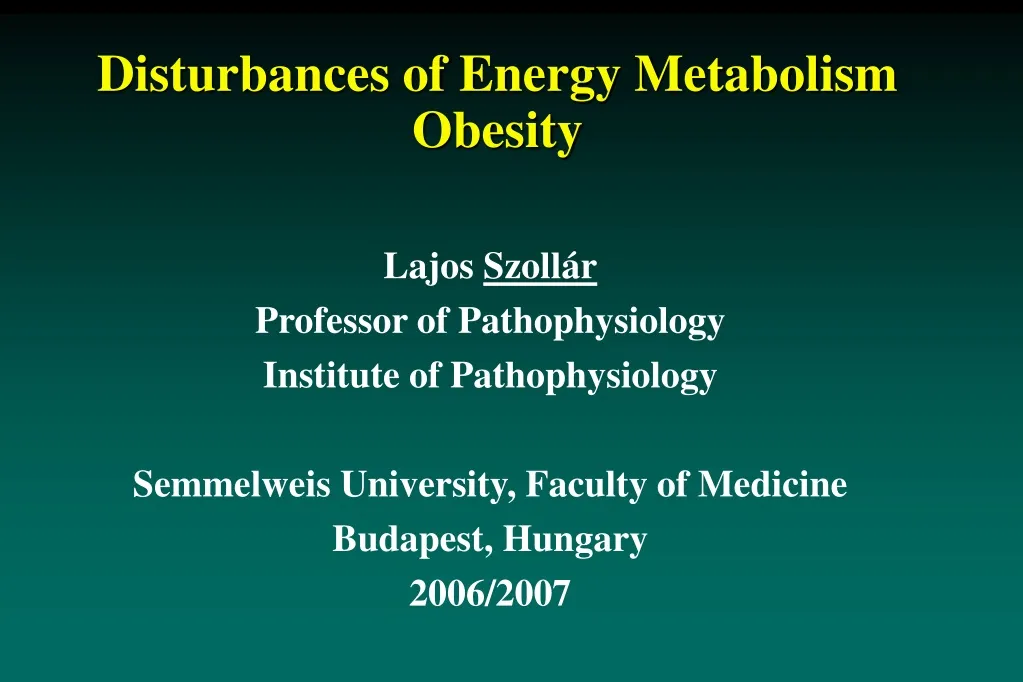
Disturbances of Energy Metabolism Obesity. Lajos Szollár Professor of Pathophysiology Institute of Pathophysiology Semmelweis University, Faculty of Medicine Budapest, Hungary 200 6 /200 7. STARVATION Fuel Reserves Substrate Fluxes in FED in FASTING State

E N D
Disturbances of Energy MetabolismObesity Lajos Szollár Professor of Pathophysiology Institute of Pathophysiology Semmelweis University, Faculty of Medicine Budapest, Hungary 2006/2007
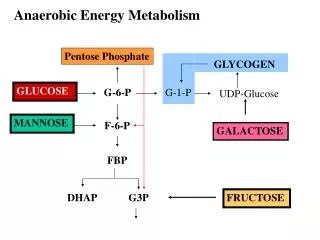
STARVATION Fuel Reserves Substrate Fluxes in FED in FASTING State Metabolic Responses to SHORT-TERM PROLONGED Starvation
OBESITY • Fat homeostasis in man • Criteria of obesity • Methods for estimating fat tissue clinically useful anthropometric methods
Obesity • Definition of obesity: Increase of adipose tissue • Criteria of obesity, grade of severity • Broca-index, relatíve weight, ideal weight, body mass index • Frequency, geographical distribution, time-trends • Effects on mortality and morbidity • Consequences and complications • Classification of obesity • Hypertrophic-hyperplastic • Central-peripheral • Pathogenesis of obesity
ENERGY RESERVES IN LEAN AND OBESE SUBJECTS(After Bray, 1976 ) Lean Obese kg kJ kg kJ Body weight 70 100 Fat (triglyceride) 15 564.840 40 1.506.240 Proteine (muscle) 6 100.416 7 117.152 Glycogen 0.07 1.170 0.07 1.170
Obesity • Definition of obesity: Increase of adipose tissue • Criteria of obesity, grade of severity • Broca-index, relatíve weight, ideal weight, BMI (body mass index) • Frequency, geographical distribution, time-trends • Effects on mortality and morbidity • Consequences and complications • Classification of obesity • Hypertrophic-hyperplastic • Central-peripheral • Pathogenesis of obesity
Definitions • Body Mass Index (BMI) describes relative • weight for height: weight (kg)/height (m2) • Overweight = 25–29.9 BMI • Obesity = >30 BMI
Classification of overweight in adults according to BMI. Obesity is classified as BMI > 30 kg/m² BMI (kg/m²) Risk of comorbidities CLASSIFICATION Underweight <18.5 Low (but risk of other clinical problems increased) Normal range 18.5-24.9 Average Overweight > 25 Pre-obese 25.0-29.9 Increased Obese class I 30.0-34.9 Moderate Obese Class II 35.0-39.9 Severe Very severe Obese Class III > 40.0
Obesity • Definition of obesity: Increase of adipose tissue • Criteria of obesity, grade of severity • Broca-index, relatíve weight, ideal weight, body mass index • Frequency, geographical distribution, time-trends • Effects on mortality and morbidity • Consequences and complications • Classification of obesity • Hypertrophic-hyperplastic • Central-peripheral • Pathogenesis of obesity
GLOBAL PREVALENCE OF OBESITY (defined as BMI > 30) Year * Women Men Age range 25-69 W.Samoa (urban) 18+ Kuwait 25-64 East Germany 20-74 USA 15+ Saudi Arabia 25-69 W. Germany 20-65 Czech Republic 16-64 England 18-74 Canada 20-59 20-69 Netherlands 15-64 Australia 25-64 Brazil 20+ Japan 20-45 China 80 70 60 50 40 30 20 10 0 10 20 30 40 50 60 70 80 * Most recent available data. Surveys % population conducted between 1988 and 1994.
Historic, current and projected obesity prevalence rates (BMI > 30) Kopelman, Nature 404:635, 2000
Hypertension Type 2 diabetes Coronary heart disease Gallbladder disease Certain cancers Dyslipidemia Stroke Osteoarthritis Sleep apnea Background Approximately 108 million American adults are overweight or obese. Increased risk of: CDC/NCHS NHANES 1999
(*BMI > 30, or ~ 30 lbs overweight for 5’4” woman) Obesity Trends* Among U.S. Adults: BRFSS, 1988 Mokdad A.H., CDC
(*BMI > 30, or ~ 30 lbs overweight for 5’4” woman) Obesity Trends* Among U.S. Adults: BRFSS, 1994 Mokdad A H, et al. J Am Med Assoc 1999; 282:16
Obesity Trends Among* U.S. Adults: BRFSS, 2000 (*BMI > 30, or ~ 30 lbs overweight for 5’4” woman) Mokdad A H, et al. J Am Med Assoc 2001; 286:10
Obesity • Definition of obesity: Increase of adipose tissue • Criteria of obesity, grade of severity • Broca-index, relatíve weight, ideal weight, body mass index • Frequency, geographical distribution, time-trends • Effects on mortality and morbidity • Consequences and complications • Classification of obesity • Hypertrophic-hyperplastic • Central-peripheral • Pathogenesis of obesity
Bray GA. Overweight is risking fate. Definition, classification, prevalence and risks. Ann NY Acad Sci 1987;499:14-28. Relationship of BMI to Excess Mortality 300 Age at Issue 20-29 250 30-39 200 150 Mortality Ratio 100 High Moderate Low Risk Risk Risk 50 0 15 20 25 30 35 40 Body Mass Index (kg/[m2])
BMI and relative risk (a=woman b=men) Kopelman, Nature 404:635, 2000
Obesity and Diabetes Risk Incidence of New Cases per 1,000 Person-Years BMI Levels Knowler WC et al. Am J Epidemiol 1981;113:144-156.
Hypertension 60 50 40 Percentage 30 20 10 20 25 30 35 40 BMI Relationship between BMI and crude percentage of women reporting medical problems, surgical procedures, symptoms, and health care utilization. Brown WJ et al. Int J Obes 1998;22:520-528.
NHANES III Prevalence of Hypertension* According to BMI Percent *Defined as mean systolic blood pressure 140 mm Hg, mean diastolic 90 mm Hg, or currently taking antihypertensive medication. Brown C et al. Body Mass Index and the Prevalence of Hypertension and Dyslipidemia. Obes Res. 2000; 8:605-619.
Cholescystectomy 25 20 Percentage 15 10 5 20 25 30 35 40 BMI Relationship between BMI and crude percentage of women reporting medical problems, surgical procedures, symptoms, and health care utilization. Brown WJ et al. Int J Obes 1998;22:520-528.
26 -Year Incidence of Coronary Heart Disease in Men Incidence/1,000 BMI Levels Adapted from Hubert HB et al. Circulation 1983;67:968-977. Metropolitan Relative Weight of 110 is a BMI of approximately 25.
Obesity • Definition of obesity: Increase of adipose tissue • Criteria of obesity, grade of severity • Broca-index, relatíve weight, ideal weight, body mass index • Frequency, geographical distribution, time-trends • Effects on mortality and morbidity • Consequences and complications • Classification of obesity • Hypertrophic-hyperplastic • Central-peripheral • Pathogenesis of obesity