Download

1 / 21
210 likes | 308 Views
M. Amann, I. Bertok, J. Cofala, F. Gyarfas, C. Heyes. Z. Klimont, W. Sch öpp, W. Winiwarter. The CAFE baseline scenarios: Key findings. Anthropogenic contribution to PM2.5. 2000 2010 2020. Rural concentrations, annual mean [µg/m 3 ]

E N D
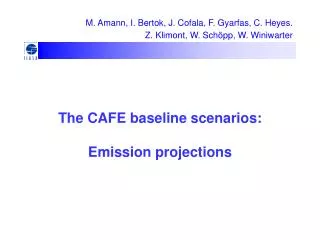
M. Amann, I. Bertok, J. Cofala, F. Gyarfas, C. Heyes. Z. Klimont, W. Schöpp, W. Winiwarter The CAFE baseline scenarios: Key findings
Anthropogenic contribution to PM2.5 2000 2010 2020 Rural concentrations, annual mean [µg/m3] from known anthropogenic sources excluding sec. org. aerosols Average of calculations for 1997, 1999, 2000 & 2003 meteorologies
Loss in life expectancyattributable to anthropogenic PM2.5 [months] 2000 2010 2020 Loss in average statistical life expectancy due to identified anthropogenic PM2.5Average of calculations for 1997, 1999, 2000 & 2003 meteorologies
Loss in life expectancyattributable to anthropogenic PM2.5 [months]
Health-relevant ozone concentrations[SOMO35, ppb.days] 2000 2010 2020 Rural concentrations Average of calculations for 1997, 1999, 2000 & 2003 meteorologies
Premature deaths attributable to ozone[cases/year] Provisional calculations with 50*50 km resolution
Acid deposition to forests 2000 2010 2020 Percentage of forest areawith acid deposition above critical loads, using ecosystem-specific deposition, Average of calculations for 1997, 1999, 2000 & 2003 meteorologies
Percent of forest area with acid deposition above critical loads
Acid deposition to semi-natural ecosystems including HABITAT areas 2000 2010 2020 Percentage of area of semi-natural ecosystemswith acid deposition above critical loads, using ecosystem-specific deposition. Average of calculations for 1997, 1999, 2000 & 2003 meteorologies
Semi-natural ecosystemswith acid deposition above critical loads [km2]
Excess of critical loads for eutrophication 2000 2010 2020 Percentage of ecosystems area with nitrogen deposition above critical loads, using grid-average deposition. Average of calculations for 1997, 1999, 2000 & 2003 meteorologies
Percent of ecosystems area with nitrogen deposition above critical loads for eutrophication
Conclusions • With decreasing pollution, also impacts are expected to decline in the future. • However, problems will not be entirely resolved: • PM remains serious (~5 months life expectancy loss in 2020) • Ozone: • Remains a significant cause for premature deaths (Several 1000 cases in 2020) • Vegetation damage: Wide-spread violations of AOT40 critical level will prevail • Acidification: Will not disappear, mainly due to NH3 • Eutrophication remains unresolved
Power generation Industry Domestic Transport Agriculture Industrial processes NEC emission ceiling SO2 emissions by sector“With climate measures” scenario [kt] NewMemberStates EU-15
Power generation Industry Domestic Transport Agriculture Industrial processes NEC emission ceiling NOx emissions by sector“With climate measures” scenario [kt] New MemberStates EU-15
Power generation Industry Households Transport Agriculture Solvents Waste National Emission Ceilings VOC emissions“With climate measures” scenario [kt] New Member States EU-15
Power generation Industry Domestic Transport Agriculture Industrial processes NEC emission ceiling NH3 emissions “Pre-CAP reform” scenario [kt] NewMemberStates EU-15
Power generation Industry Domestic Transport Agriculture Industrial processes NEC emission ceiling PM2.5 emissions by sector“With climate measures” scenario [kt] NewMemberStates EU-15
Contribution to primary PM2.5 emissions “With climate measures” scenario, EU-15
Conclusions • While accounting for continued economic growth … • National emissions of air pollutants will decrease up to 2020: SO2 -65%, NOx-50%, VOC -45%, NH3 -4%, PM2.5 -45% • Due to structural changes and emission control legislation • Relevance of sectors for further measures will change. • Small combustion sources! • Industrial processes, solvents! • Off-road vehicles and machinery! • Emissions from maritime activities will surpass land-based emissions of EU-25