Download
1 / 14
140 likes | 407 Views
Methods for characterization of porous materials.

E N D
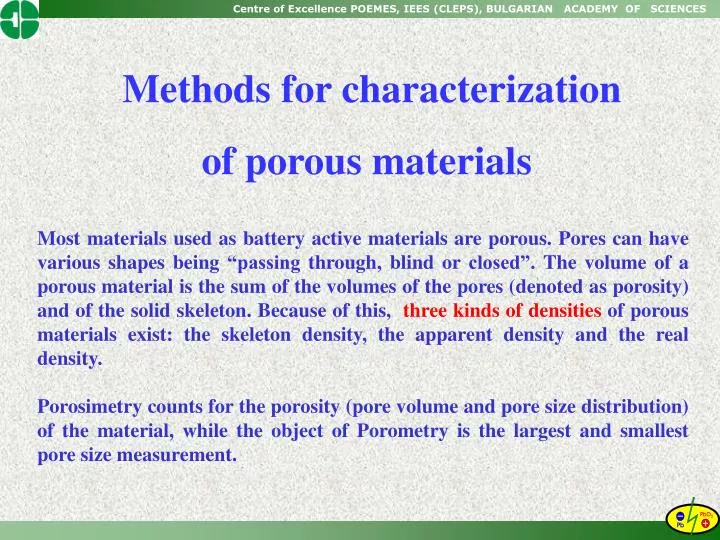
Methods for characterization of porous materials Most materials used as battery active materials are porous. Pores can have various shapes being “passing through, blind or closed”. The volume of a porous material is the sum of the volumes of the pores (denoted as porosity) and of the solid skeleton. Because of this, three kinds of densities of porous materials exist: the skeleton density, the apparent density and the real density. Porosimetry counts for the porosity (pore volume and pore size distribution) of the material, while the object of Porometry is the largest and smallest pore size measurement.
passing through “blind” pore types closed internal Porous materials, porosity V = Vsolid + Vvoid Porosity: P = Vvoid/V = 1 –Vsolid/V Solid part: S = Vsolid/V = 1 –Vvoid/V rappar = m/V rreal = m/Vreal rskeleton = m/Vsolid Porosimetry: porosity (pore volume and pore size distribution). Porometry: largest and smallest pore size measurement. Source: T.Plachenov and S.Kolosencev, Porometry, Chimija (Rus), Leningrad, 1988.
Methods for characterisation of porous materials • Total pore voulme (porosity), pore shape and size, • Pore distribution by size (diameter), • Pore surface distribution, specific surface • Adsorption (molecular adsorption on solids ) –for extremely porous samples – pore volume, even the smallest pores, Brunauer, Emmett, Teller (BET) method for specific surface measurements 9-200oC, 0.1 – 1000 m2/g), range 0.3 – 700 nm. • Pycnometry (density of the solid sample) – total pore volume, pore volume, size and distribution even of the smallest pores, range 0.2 – 1 nm.liquid - gas – He or a set of gases with known molecular size and adsorption on the sample. • Calorimetry (thermal effect of wetting liquid penetration into the pores) – specific surface, micropore size and distribution, range 0.5 – 1 nm. • Volumetric (filling up the volume of the pores, weight or volume of gas/liquid ) – porosity, pore volume and size, range 1 nm – 1000 mm. • Mercury intrusion (under increasing pressure) – pore size and distribution, specific surface, range 1.5 nm – 800 mm. • Small angle X-rays or neutron dissipation (0 – 2 degrees) – micropore size and distribution, closed pores, range 0.5 – 700 nm. • Etalon porometry – (comparative volume saturation) - all kind of samples: hard, soft or elastic, brittle, pore volume and distribution, range 2 nm – 1000 mm. • A comparison with data from direct observation (SEM) is obligatory!
Mercury Intrusion Porosimetry Mercury intrusion porosimetry belongs to the most frequently used porometric methods. Reliable devices produced in series are available. The principle of the method is based on the penetration of liquids into small cylindrical pores. The diameter of the pores is calculated from the pressure value taking into account the surface tension and the wetting angle of the liquid by Washburn’s equation. The sample is dried, degassed, precisely weight (~1.0 g). Than it is poured into a special container, the penetrometer. The column is filled up from its bottom orifice with mercury by a vacuum pump. Then the pressure is increased, first using a low pressure pump, later using the high pressure one. Part of the mercury penetrates into the pores of the sample. This mercury volume change is measured precisely by capacitance change (between the mercury column and the metal surrounding), resistance or radiation intensity. The method provides data about pore size and distribution, bulk density and apparent density of the sample. Source: http://www.quantachrome.com; http://www.pml.tno.nl
penetrometer sample Penetrometers for solid and powder samples (3-5-15 cm3) mercury low pressure high pressure 4100 bar 2 bar pump pump vacuum pump Mercury Intrusion Porosimetry Penetration of liquids into small cylindrical pores. Washburn’s equation D = +/- 4s.cosq / P D – pore diameter, P – pressure applied s - surface tension (for Hg: 480 dyne cm-1), Hg wetting angle = 135 - 180o (>90o - non wetting) • Sample: dried, degassed, weight (~1.0 g). • vacuum, filling up with mercury • pressure, intrusion, volume measurement • V = f (P) • mercury volume changes: measured by capacitance change (between the mercury column and the metal surrounding), resistance or radiation intensity. • pore volume • pore size and distribution • bulk density • apparent density Source: http://www.quantachrome.com; http://www.pml.tno.nl
MIP test protocols and data interpretation LP EQUILIBRATION = +10.0000 SEC PNTR CONSTANT = +21.6300 MICRO-L/PF HP EQUILIBRATION = +15.0000 SEC THETA = +140.0000 SAMPLE WEIGHT = +6.0540 G GAMMA = +485.0000 DYNES/CM PNTR WEIGHT = +68.5890 G INITIAL PRESSURE = +0.8425 PSIA PNTR+SAMPLE WEIGHT = +74.6430 G STEM VOLUME = +1.1000 CC PNTR+SAMPLE+MERCURY = +113.3080 G MERCURY DENSITY = +13.5335 G/CC PNTR VOLUME = +4.3600 CC INTRUSION (PRESSURIZATION) DATA SUMMARY TOTAL INTRUSION VOLUME = +0.1293 CC/G TOTAL PORE AREA = +4.8186 SQ-M/G MEDIAN PORE RADIUS (VOLUME) = +0.3650 MICROMETERS MEDIAN PORE RADIUS (AREA) = +0.0105 MICROMETERS AVERAGE PORE RADIUS (4V/A) = +0.0537 MICROMETERS BULK DENSITY = +4.0279 G/CC APPARENT (SKELETAL) DENSITY = +8.4052 G/CC % CAPILLARY = +71.1587 PRESSURE PORE INTRUSION PORE MEAN PSIA RADIUS VOLUME SURFACE RADIUS DV MICRO-MCC/G SQ-M/G MICRO-M +0.8 +127.9200 +0.0000 +0.0000 +127.9200 +0.0000 +1.0 +113.1600 +0.0001 +0.0000 +120.5400 +0.0001 +1.9 +55.3038 +0.0013 +0.0000 +84.2318 +0.0012
Mercury porograms for PAM, NAM, 3BS and 4BS pastes NAM with 3 additives SS in m2/g (BET): 3BS – 1 NAM – 0.5 - 1 cumulative differential SS in m2/g (BET): 3BS - 1 4BS – <0.5 PAM – 2 - 10 Cumulative and differential curves vs. pore diameter Cumulativeporograms Source: A. Gigova, to be published
Capillary Flow Porometry The method of capillary flow porometry is used to characterise AGM, which is soft and can’t be studied by MIP. Principle: (i) Initially the pores are filled spontaneously by a thin liquid with low surface tension. This happens when the surface free energy on the surface liquid/sample is smaller than the surface free energy on the surface gas/sample. (ii) Then gas with increasing pressure is pumped through the sample. The gas pushes the liquid out of the pores. The total surface gas/sample increases and the total surface liquid/sample decreases. The equation for the pore diameter follows Washburn’s equation. The largest pores are opened by the smallest pressure, called “bubble point”. On further pressure increase the gas flow increases since more and more smaller pores are opened. Sources: http://www.mplp.com/tech; A. K. Jena and K. M. Gupta, Journal of Power Sources, Volume 80, 1999, pp. 46-52; Vibhor Gupta and A. K. Jena, Advances in Filtration and Separation Technology, Volume 13b, 1999, pp. 833-844; http://www.ceramicindustry.com
Capillary Flow Porometry Thus first a “dry curve” is recorded with gas only. Than the “half-wet” curve is built assuming half of the pores are still filled with fluid. The sample is filled with the real fluid and the gas pressure starts to increase. The bubble point is detected when the first portion of gas passes through the sample. From the cross point of the half-wet and the wet curve the “mean flow” is determined. The high pressure value at which all pores are open and the wet curve approaches the dry one is used to calculate the smallest pore diameter. Flow porometry measures the diameter of the constricted part of the pore. Since the glass fibres are oriented during AGM processing, the pore distribution of the AGM sample (in the right part of the next graph) often depends on the geometrical direction of measurement – parallel or normal to the surface. Two device designs are illustrated - for porosity measurements along the axis z and along the axes x/y. Sources: http://www.mplp.com/tech; A. K. Jena and K. M. Gupta, Journal of Power Sources, Volume 80, 1999, pp. 46-52; Vibhor Gupta and A. K. Jena, Advances in Filtration and Separation Technology, Volume 13b, 1999, pp. 833-844; http://www.ceramicindustry.com
pores: large medium small L D D S D gas Gas flow rate as a function of differential pressure. wet curve dry curve half – wet curve mean flow bubble point Capillary flow porometry • pores filled spontaneously with a low surface tension wetting liquid. • Fs(liquid/sample) < Fs(gas/sample). • gas displaces the liquid from the pores. • S(gas/sample) > S(liquid/sample), i.e. Fs increases. • Main equation for the pore diameter D: • D = 4s/p • s – surface tension, p - differential pressure for • displacement of the wetting liquid in a pore • the largest pore emptied by the smallest pressure. • gas flow start: largest pore – bubble point • gas flow increasing with pressure (smaller pores). Flow porometry measures the diameter of the constricted part of the pore. Sources: http://www.mplp.com/tech; A. K. Jena and K. M. Gupta, Journal of Power Sources, Volume 80, 1999, pp. 46-52; Vibhor Gupta and A. K. Jena, Advances in Filtration and Separation Technology, Volume 13b, 1999, pp. 833-844; http://www.ceramicindustry.com
z y non porous x sample non porous non porous gas Capillary flow porometers Flow porometry along the z-direction (homogeneous materials) Flow porometry along the x-y-directions (multi-layer and thin layer materials) Sources: http://www.mplp.com/tech; A. K. Jena and K. M. Gupta, Journal of Power Sources, Volume 80, 1999, pp. 46-52; Vibhor Gupta and A. K. Jena, Advances in Filtration and Separation Technology, Volume 13b, 1999, pp. 833-844; http://www.ceramicindustry.com
CFP test protocols and data interpretation PORE DISTRIBUTION = FILTER FLOW% / (LASTDIA-DIA.) FILTER FLOW = WET FLOW / DRY FLOW Example: SMALLEST DETECTED PORE PRESSURE = 4.275 PSI SMALLEST DETECTED PORE DIAMETER = 2.1646mm MEAN FLOW PORE PRESSURE = 3.816 PSI MEAN FLOW PORE DIAMETER = 2.4255mm BUBBLE POINT PRESSURE = 0.672 PSI BUBBLE POINT PORE DIAMETER = 13.7697mm MAXIMUM PORE SIZE DISTRIBUTION = 2583.6707 DIAMETER AT MAX. PORE SIZE DISTRIBUTION = 2.4075 mm
Capillary flow porometry of two AGM separator materials AGM-1: 2,42 mm AGM-2: 4,10 mm AGM-1: 2,42 mm AGM-2: 4,10 mm 2,42 - 4,10 mm Source: A. Gigova, to be published
Contributions to VRLAB knowledge made using porosimetry and porometry • Structure and properties of the positive active material (Hg). • Influence of additives to the negative plate to its properties (Hg). • Structure and properties of separators (PVC, PE, AGM - CFP). • Gas transport in the system pos. plate – separator – neg. plate in VRLAB.