Download
1 / 44
470 likes | 644 Views
Total Survey Error Design, Implementation, and Evaluation. Paul P. Biemer RTI International and University of North Carolina at Chapel Hill. Modern View of Survey Design. Surveys should be designed to maximize total survey quality within timeliness and budget constraints. But how when…

E N D
Total Survey ErrorDesign, Implementation, and Evaluation Paul P. Biemer RTI International and University of North Carolina at Chapel Hill
Modern View of Survey Design • Surveys should be designed to maximize total survey quality within timeliness and budget constraints. • But how when… • survey budgets are severely constrained, • data must be produced and disseminated in a timely fashion, • public interest in participating in surveys has been declining world-wide for years, and • even when participation is obtained, responses may not be accurate. • This is the challenge for survey research in the 21st century
Outline • What is total survey quality? • How does it differ from total survey error? • How can surveys be designed to maximize total survey quality? • What is the total survey error paradigm and what does it say about the design, implementation, and evaluation of survey?
User and Producer Have Very Different Perspectives on Survey Quality • Producers place high priority on • Accuracy – total survey error is minimized • Credibility – credible methodologies; trustworthy data • Users place higher priority on • Timeliness – data deliveries adhere to schedules • Relevance – data satisfy user needs • Accessibility – access to data is user friendly • Interpretability – documentation is clear; meta-data are well-managed
Users Also Demand… • Comparability – valid demographic, spatial and temporal comparisons • Coherence – estimates from different sources can be reliably combined • Completeness – data are rich enough to satisfy the analysis objectives without undue burden on respondents
TSQ Optimally Balances Producer and User Requirements Timeliness Accessibility Comparability Coherence Completeness Relevance Accuracy Credibility Interpretability User Producer
The Total Survey Quality Paradigm • Identifies measurable and achievable objectives for each user-defined dimension of quality • Determines costs and resources required to achieve these objectives • Maximizes survey accuracy within remaining budget
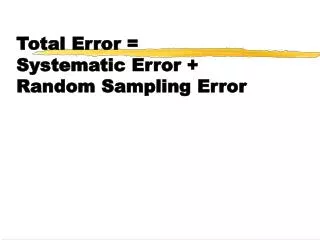
Mean Squared Error (MSE) MSE = Bias2 + Variance Total Survey Error • Sampling Error • Sampling scheme • Sample size • Estimator choice Systematic Bias Variable Variance • Nonsampling Error • Specification • Nonresponse • Frame • Measurement • Data processing Accuracy is maximized by minimizing total survey error
Optimal Design for Total Survey Quality Total Survey Quality Minimize total survey error Accuracy Subject to budget Sampling error Timeliness time Specification error Accessibility Nonresponse error Frame error Interpretability constraints Measurement error Comparability Data processing error Credibility
Designing Surveys to Minimize Total Survey Error Objective – minimum mean squared error (MSE) subject to cost and timeliness constraints • Major bias contributors • concept misspecification • frame noncoverage • nonresponse • measurement bias • editing errors • Major variance contributors • sampling error • measurement unreliability • interviewer error
Key Design Principles • Design robustness – accuracy does not change appreciably as the survey design features change; i.e. optimum is “flat” over a range of alternate designs • Effect generalizability – design features found to be optimal for one survey are often generalizable to other similar surveys optimum accuracy
Key Design Principles • Design robustness – accuracy does not change appreciably as the survey design features change; i.e. optimum is “flat” over a range of alternate designs • Effect generalizability – design features found to be optimal for one survey are often generalizable to other similar surveys loss in accuracy
Implications for Design • Compile information on TSE (e.g., quality profiles) • Identify major contributors to TSE • Allocate resources to control these errors • Use results from the literature and other similar surveys to guide the design • Develop an effective process for modifying the design during implementation to achieve optimality • Embed experiments and conduct studies to obtain data on TSE for future surveys
Design Implementation Strategies The initial survey design must modified or adapted during implementation to control costs and maximize quality. Four strategies for reducing costs and errors in real-time: • Continuous quality improvement • Responsive design • Six Sigma • Adaptive total design and implementation Initial quality Final quality
Continuous Quality Improvement (CQI) • Prepare a workflow diagram of the process and identify key process variables. • Identify characteristics of the process that are critical to quality (CTQ). • Develop real-time, reliable metrics for the cost and quality of each CTQ. • Continuously monitor costs and quality metrics during the process. • Intervene as necessary to ensure that quality and costs are within acceptable limits.
Responsive Design Strategy • Developed for face to face data collection (Groves & Heeringa, 2006) • Similar to CQI but includes three phases: • Experimental phase – tests major design options • For e.g., split sample designs to test incentive levels • Main data collection phase – implements design selected in first phase • Continues until “phase capacity” is reached • NRFU phase – special methods implemented to reduce nonresponse bias and control data collection costs • NR double sampling, higher incentives, more intensive followup • Phase capacity – point at which efforts to reduce NR bias under current protocol are no longer cost effective • Innovative uses of paradata for CQI
Six Sigma • Developed by Motorola in the 1980’s • Definition (from Pande, et al, 2000, p. xi) • Extends ideas of Total Quality Management (TQM) and continuous quality improvement (CQI) • Has mostly been applied in business and manufacturing. “A comprehensive and flexible system for achieving, sustaining and maximizing business success,…uniquely driven by a close understanding of customer needs, disciplined use of facts, data, and statistical analysis, and diligent attention to managing, improving, and reinventing business processes.” – Pande, et al (2000, p. xi)
Strengths of Six Sigma • Provides a systematic, highly effective approach for quality improvement (DMAIC). • Focuses on attributes of a process that are most important to the client. • Emphasizes decision making based on data analysis. • Strives for verifiable and sustainable improvements for both costs and quality. • Contains a rich set of techniques and tools for monitoring, controlling, and improving a process.
Weaknesses of Six Sigma • Can be expensive to implement. • Achieving 3.4 defects per million opportunities is an impossible goal for many survey processes. • Often requires data that do not exist and cannot be obtained affordably. • Terminology and some techniques are too business and manufacturing oriented. This obscures its applicability to survey work. • Uses a lot of jargon.
Six Sigma’s DMAIC Strategy • Define the problem. • Measure key aspects of the process and collect relevant data. • Analyze the data to determine root causes of the problem. • Improve the process based upon results from the data analysis. • Control the process by continuously monitoring metrics from the process.
Typical Survey Design and Implementation Process Develop a survey design with design options A, B, etc Monitor critical-to-quality design attributes (CTQs) 1 1 Post-survey processing, adjustment, and file preparation Modify design to maximize accuracy while meeting cost and timeliness objectives Pretest design and options Pre-release quality evaluations Budget or schedule exhausted? Data release STOP Select and Implement best design option no yes
Six Sigma Focuses Primarily on these Activities Develop a survey design with design options A, B, etc Monitor critical-to-quality design attributes (CTQs) 1 1 Post-survey processing, adjustment, and file preparation Modify design to maximize accuracy while meeting cost and timeliness objectives Pretest design and options Pre-release quality evaluations Budget or schedule exhausted? Data release STOP Select and Implement best design option no yes
Adaptive Total Design and Implementation • An approach for continuously monitoring survey processes to control errors, improve quality, and reduce costs. • Adaptive in that it combines the real-time error control features of CQI, responsive design, and Six Sigma strategies. • Total in that it simultaneously monitors multiple sources; for e.g., • Sampling frame and sampling • Response quality • Nonresponse bias reduction • Field production • Costs and timeliness
Six Sigma Tools and Concepts • Workflow diagram • Common vs. special cause variation • Process control chart • Dashboard • Fishbone diagram • Pareto chart • Many others are available (see Breyfogle, 2003))
Workflow Diagram for Sampling and Initial Interview Attempt 1 1 1 2 3 Contact? Interview? Compute domain sample size Compute current eligibility rate Compute required sample per PSU 2 3 4 3 Select sample lines to send to field Assign case priorities Transmit to FS’s in field 5 4 5 6 4 Conduct travel efficiency sessions Optimize work sequence order Assign cases to FIs 7 Yes Yes FI places initial contact attempt 2 8 9 Complete ROC log Set appointment 1 • Critical to quality key: • Achieve target sample sizes for each domain • Distribute sample to PSUs to minimize design effects • FI workloads must be adequate • Ensure high response propensity for high priority cases • Minimize FI travel costs through work sequence optimization • Ensure that high priority cases are worked fully • Ensure good cooperation at first contact • Record of calls (ROC) is completed accurately • Schedule an firm appointment after each contact
CTQs and Metrics for Frame Construction and Sampling • CTQs • Maximize frame coverage • Maximize within unit coverage • Detect/control duplications and • ineligibles • Effectively post-stratified sample • for bias reduction • Use auxiliary data and efficient • estimators to minimize sampling • error • Minimize design effects for key • analytic domains • Achieve target sample allocations • for key domains • Optimally allocate sample to strata • and sampling stages • Process Metrics • Ineligibility rates by domain, PSU, • and overall • Achieved # interviews by domain • # HU's identified by q.c. • Projected vs. actual coverage • Design effects by domain • Screener mean propensity • Interview mean propensity • # active cases
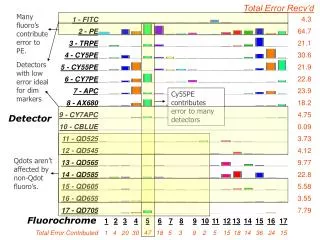
CTQs and Metrics for Observation Quality • CTQs • Detect/control post-survey • measurement errors • Identify/repair problematic survey • questions • Detect/control response errors • Minimize interviewer biases and • variances • Process Metrics • CARI results by interviewer and • overall • Interviewer exception report • Missing data item frequency by • interviewer • Replicate measurement analysis • summary • Interview length by interviewer • CARI refusal rate by FI, by • phase
CTQs and Metrics for Nonresponse Followup • CTQs • Maximize response rates • Minimize nonresponse bias • Effectively adjust for unit • nonresponse • Effectively impute missing data for • key items • Process Metrics • Overall Phase 3 sampling rate by • PSU and overall • Response rate for high priority • cases • Hours per converted • nonrespondent (refusal vs. other) • Projected WRR by PSU and overall • (actual vs. expected) • Projected design effects by domain • Budgeted vs actual hours charged • for Phase II
CTQs and Metrics for Costs, Production, and Timeliness • CTQs • Maximizing interviewing efficiency • Maximize effectiveness of refusal • conversions attempts • Complete call histories accurately • and completely • Minimize hours per completed • screener • Minimizes hours per completed • interview • Maintain planned costs per quarter • Maintain planned schedule for • sample completion per quarter • Process Metrics • Cost per interview • Dollars spent vs. dollars budgeted • by interviewer • Dollars spent vs. value of work • conducted by interviewer • Cost breakdown (by phase and • overall) • Number of cases interviewed • (actual vs. budgeted) • Calls per hour (actual vs. expected) • Refusal conversion rates by • interviewer • Hours charged (actual vs. • expected) • Level of effort per case by • interviewer and overall • Hours per completed screener • Hours per completed interview
Special vs. Common Cause Variation • Special causes – assignable to events and circumstances that are extraordinary, rare and unexpected • e.g., frame was not sorted prior to sampling • Addressed by actions specific to the cause leaving the design of the process essentially unchanged • Common causes – naturally occurring random disturbances that are inherent in any process and cannot be avoided. • e.g., normal fluctuations of response across regions and months • Actions designed to address a common cause is neither required nor advisable; this lead to process “tampering”
Chart of Screening Response Rates by County Problem counties?
Process Control Chart with More Extreme Values Special cause
Example of a Dashboard Interviewer Efficiency - Contacting and Locating
Dashboard Showing Weighted Response Rates, Interview Costs, Interviewer Exceptions and Production
Other Useful Tools • Cause and effect (fishbone) diagrams • Helps to identify all possible root causes of a problem • An important component of the measure stage of DMAIC. Economy Supervision Availability of higher paying jobs Reward system Poor supervision Lack of benefits Interviewer turnover Misinformation from other FIs Lack of steady work Family situation Low pay Conflict with supervisor Inadequate training Job difficulty Unrealistic employee expectations Job characteristics Personal reasons
Other Useful Tools (cont’d) • Pareto chart • Useful for identify the “vital few” sources of process deficiencies
Total Survey Error Evaluation • Addresses several dimensions of total survey quality. • Essential for optimizing resource allocations to reduce the errors. • In experimentation, needed to compare the quality of alternative methods. • Provides valuable information on data quality for gauging uncertainty in estimates, interpreting the analysis results, and building confidence and credibility in the data.
Primary Methods • Nonresponse bias studies (required by OMB for some surveys) • Evaluates differences between respondents and nonrespondents for key survey items • Frame data or prior waves provides data on nonrespondents • Model-based approaches for nonignorable nonresponse bias • Measurement bias studies • Record check studies • Reconciled reinterviews • Internal and external consistency checks • Test-retest reinterview approaches • Embedded repeated measures analysis (e.g. structural equation modeling, latent class analysis)
Primary Methods (continued) • Other methods • Frame undercoverage evaluations • Editing error (pre- and post-editing comparisons) • Cognitive methods for detecting comprehension errors, recall problems, data sensitivity, etc. • Subject matter expert reviews of concepts vs. question meaning • Process data summaries • Response rate analysis • Data entry error rates • Edit failure rates • Missing data rates • Post-survey adjustment factors
Major Take-Home Points • Survey quality is multi-dimensional including both data user and producer dimensions. • Accuracy is maximized subject to cost and timeliness constraints • Survey design optimization begins with the initial design and extends throughout implementation and post-survey processing. • ATDI combines CQI, responsive design and Six Sigma strategies to provide a comprehensive approach for real-time reduction of total survey error and costs. • Survey evaluation is an essential component of the total survey error framework.
It is not enough to do your best; you must know what to do, and then do your best. – W. Edwards Deming