Download
1 / 26
370 likes | 836 Views
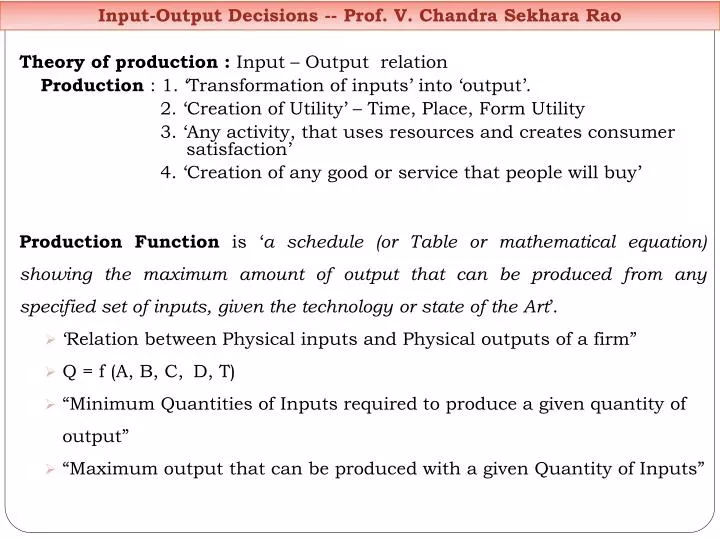
Input-Output Decisions -- Prof. V. Chandra Sekhara Rao. Theory of production : Input – Output relation Production : 1. ‘Transformation of inputs’ into ‘output’. 2. ‘Creation of Utility’ – Time, Place, Form Utility

E N D
Input-Output Decisions -- Prof. V. Chandra SekharaRao Theory of production : Input – Output relation Production : 1. ‘Transformation of inputs’ into ‘output’. 2. ‘Creation of Utility’ – Time, Place, Form Utility 3. ‘Any activity, that uses resources and creates consumer satisfaction’ 4. ‘Creation of any good or service that people will buy’ Production Function is ‘a schedule (or Table or mathematical equation) showing the maximum amount of output that can be produced from any specified set of inputs, given the technology or state of the Art’. • ‘Relation between Physical inputs and Physical outputs of a firm” • Q = f (A, B, C, D, T) • “Minimum Quantities of Inputs required to produce a given quantity of output” • “Maximum output that can be produced with a given Quantity of Inputs”
Input-Output Decisions -- Prof. V. Chandra SekharaRao Cobb – Douglas Production Function: Q = b. Q = Quantity of Output; L = Labour; C = Capital; a = is a parameter indicating the importance of labour in production Q = b. Q = b. If both Labour and Capital are increased by ‘G’ proportion, then = = G b. = GQ Senator Paul H. Douglas and Economist C.W. Cobb studied manufacturing output in US and found that Labour contributes to 75 per cent of increases in Manufacturing production and capital for the remaining 25 per cent. Cobb – Douglas Production Function is an example for constant returns to scale and is said to be linearly homogeneous or ‘homogeneous of the first degree.
Input-Output Decisions -- Prof. V. Chandra SekharaRao • Production function with one variable input • Law of variable proportions or Law of diminishing Marginal Returns : • Fixed Inputs : is one whose quantity cannot be readily changed, when • market conditions indicate that an immediate change in output is desirable. • Ex: Buildings, Machinery, Managerial personnel • Variable Input: is one whose quantity may be changed almost • instantaneously, in response to desired changes in output. Ex: Raw Material, Labour etc., • Short-Run: refers to that period of time in which quantities of certain inputs cannot be changed and output adjustments are possible only through variable inputs. • Long-Run : That period of time in which the quantities of all inputs can • be changed. All inputs are variable and there will be no fixed inputs. Output adjustments are possible without any limitation.
Input-Output Decisions -- Prof. V. Chandra SekharaRao APL = Total Product/No. of Workers MP L = ∆TP/∆Q MP L = Addition to Total Product, attributable to the addition of one more unit of labour to production process.
Input-Output Decisions -- Prof. V. Chandra SekharaRao Total - Marginal Relations: 1. When total is increasing at an increasing rate, then Marginal increases. 2. When total is increasing at a decreasing rate, then Marginal decreases. 3. When total is increasing at a constant rate, then Marginal is constant. 4. When total reaches maximum, then Marginal is zero. 5. When total is declines, then Marginal is negative.
Input-Output Decisions -- Prof. V. Chandra SekharaRao • Average - Marginal Relation : • Marginal exceeds average, when average is increasing. • Marginal lies below average, when average is decreasing. • Marginal equals average, when average reaches maximum. • Marginal reaches maximum prior to that of average.
Input-Output Decisions -- Prof. V. Chandra SekharaRao • TP Curve : Initially increases at an increasing rate from 0 to 1 and increases at a decreasing rate from 1 to 3, reaches maximum at 3 and declines, there after. • MP Curve : Initially increases, reaches maximum at point 4 and declines. While declining equals with AP at point 5 and continues to decline and becomes zero at point 6 and becomes negative there after. • AP Curve : Initially increases and reaches maximum at point 5 and declines there after. • AT Point 2 : A ray drawn from origin is tangential to TP curve at point 2 and Corresponding to that variable input uses AP reaches maximum at point 5 and equals with MP.
Input-Output Decisions -- Prof. V. Chandra SekharaRao Rational Decisions in Stage II Rational producer will never stop in Stage I and will never enter into Stage III and will always operate in Stage II
Input-Output Decisions -- Prof. V. Chandra SekharaRao TPL Curve : Initially increases at an increasing rate up to point E, then the rate of increase changes from increasing to decreasing rate up to point G and reaches maximum at point G and declines there after. APL Curve : Initially increases, reaches maximum at point J and equals with MP, and then diminishes. MPL Curve : Initially increases, reaches maximum at H and starts diminishing and while diminishing intersects A.P. at point J (AP = MP) and continues to diminish and reaches zero at C1, and finally becomes negative. At point F : AP = MP At point F : AP = FB / OB At point F : MP = FB/ OB
Input-Output Decisions -- Prof. V. Chandra SekharaRao Rational decisions in stage II : A rational producer will never operating Stage III and will never stop in stage I and he will always operate in the Stage II.
Input-Output Decisions -- Prof. V. Chandra SekharaRao • Equilibrium of producer with one variable input • (optimum quantity of variable input) • To decide the optimum quantity of variable input three pieces of • information is required : • 1. Pi : Price payable to variable input (wages payable to labourers) • 2. Po : Price received for the product. • 3. Marginal productivity of Labour • The Optimum quantity of a variable input is the amount whose • V.M.P.(Value of Marginal Product) has a value equal to the Price • of input. V.M.P. = Price of Input • Price of input / Marginal productivity = MC = PO
Input-Output Decisions -- Prof. V. Chandra SekharaRao • Cost of hiring 19th worker = $ 30 and benefit from 19th worker = 5 tons or $ 37.5 • 2. Cost of hiring 20th worker = $ 30 and benefit from 20th worker = 4 tons or $ 30 • 3. Cost of hiring 21st worker = $ 30 and benefit from 21st worker = 3 tons or $ 22.5 • 4. At 20th Worker VMP = Pi = $ 30 = $ 30 • 5. At 20th Worker MC = Po = $ 7.5 = $ 7.5
Input-Output Decisions -- Prof. V. Chandra SekharaRao Optimum quantity of variable input : • OA is optimum quantity of labour to hire • For OA, VMP = Pi • Below OA, VMP > Pi • 4. Above OA, VMP < Pi
Input-Output Decisions -- Prof. V. Chandra SekharaRao Production function with two variable inputs : • Iso-quant : An Iso-quant is a curve showing all possible combinations of • inputs, physically capable of producing a given level of output. • It is a locus of points – combinations of inputs – each of which yields the • same level of output.
Input-Output Decisions -- Prof. V. Chandra SekharaRao • The Shape of the isoquants displays the substitutability of the two inputs. • If the two inputs were perfect substitutes, the isoquants would be straight lines. • If they are good substitutes, the isoquants are slightly curved. • If they are poor substitutes, the isoquants would have a steep curvature. • 4. If the inputs can be used only in a fixed ratio, then the isoquants are right angles. Iso-Quant – I is the locus of combinations of capital and labour – Producing 100 Units of Output. Iso-Quant – II is shows different combinations of capital and labour – that can produce 200 Units of Output.
Input-Output Decisions -- Prof. V. Chandra SekharaRao • Characteristics of Iso-quants: • Slopes downward from left to right. • Cannot intersect • Relatively steep at the top and flat at the bottom and is convex to the origin. • Diminishing MRTS is the reason for the convexity • Marginal Rate of Technical Substitution (MRTS): MRTS of X for Y measures the number of units of Y that must be sacrificed per unit of X gained so as to maintain a constant level of output. The MRTS is given by the negative slope of Isoquant at a point. It is defined only for movements along an isoquant, never for movements among curves. • Slope of an Iso-quant = MRTS = ∆C / ∆L • Loss of output = gain in output = ∆C x MPC = ∆L x MPL • Therefore, • The slope of an isoquant, at any point, is equal to the ratio of the marginal products of labor and capital.
Input-Output Decisions -- Prof. V. Chandra SekharaRao Iso-costs : “An Iso-cost line is the locus of combinations of inputs, capital and labour, that can be purchased, if the entire money is spent. Its slope is the negative of the price ratio”. Ex: Price of Labour : $ 5 per unit Price of Capital : $ 10 per unit Budget Amount: $ 50 per unit Slope of an Iso-cost = Ratio of Prices of Inputs
Input-Output Decisions -- Prof. V. Chandra SekharaRao • Equilibrium - least cost combination of inputs : • At point A the producer is in equilibrium • At point A Iso-quant 1 is tangent to Iso-cost line. This is the least cost combination of inputs. • At point C, same output can be produced as at point 1, but at a higher cost. • At point A, the slope of Iso-quant = Slope of Iso-Cost
Input-Output Decisions -- Prof. V. Chandra SekharaRao • Equilibrium of producer with more than two variable inputs : • (optimum combination of inputs) • Equilibrium conditions for Optimum quantity of one variable input : • 1. VMP = Pi 2. MC = Po • Equilibrium conditions for Optimum quantity of two variable inputs : • Equilibrium conditions for Optimum quantity of more than two variable inputs :
Input-Output Decisions -- Prof. V. Chandra SekharaRao • Production function with all variable inputs : Returns to Scale • Increasing returns to scale : If the increase in output is more than proportional to the increase in inputs. • 10% increase in inputs result in more than 10% increase in output • Constant returns to scale : If the increase in output is proportional to the increase in inputs. • 10% increase in inputs result in 10% increase in output • Decreasing returns to scale : If the increase in output is less than proportional to the increase in inputs. • 10% increase in inputs result in less than 10% increase in output
Input-Output Decisions -- Prof. V. Chandra SekharaRao • Increasing Returns to Scale : Economies of scale and increasing returns are two sides of the same coin. • Reasons : 1. Purely Dimensional relations : • a. If the diameter of the pipe is doubled, the flow is more than doubled. • b. A wooden box of 3 foot cube contains 27 times more than a wooden box of one cube • 2. Indivisibility of Equipment • 3. Specialisation and division of labour • Decreasing Returns to Scale : • Mounting Problems of Coordination and Control • The services of entrepreneur is fixed. So, it is a case of diminishing marginal returns.
Input-Output Decisions -- Prof. V. Chandra SekharaRao Increasing Returns - with the help of Iso-Quant Map 400 Capital 300 A3 The successive Isoquants steadily came closer together. The isoquants for 200 units would be closer to the isoquants for 100 units; doubling the output would require less than twice the quantities of inputs. Similarly, the isoquants for 300 units would be closer to that for 200 units. A2 200 B3 A1 B2 100 B1 A B Labour O OA > AA1 > A1A2 > A2A3 OB > BB1 > B1B2 > B1B3
Input-Output Decisions -- Prof. V. Chandra SekharaRao Constant Returns - with the help of Iso-Quant Map Capital 300 C 200 The Isoquants for 100, 200, 300 and so on, units of output intersect the straight lines OA or OA1 at equal distances. Thus it requires twice as much of both capital and labour to produce 200 units instead of 100 units, 50% more to produce 300 units instead of 200 and so on. C1 B 100 B1 A A1 Labour O OA = AB = BC OA1=A1B1 = B1C1
Input-Output Decisions -- Prof. V. Chandra SekharaRao 400 Decreasing Returns – with the help of Iso-Quant Map Capital A3 300 B3 A2 The successive Isoquants would have to be spaced steadily farther apart. The isoquants for 200 units would be far away from the isoquants for 100 units; doubling the output would require more than twice the quantities of inputs. Similarly, the isoquants for 300 units would be far away from that of 200 units. 200 B2 A1 100 B1 A B Labour O OA < AA1 < A1A2 < A2A3 OB < BB1 < B1B2 < B1B3
Input-Output Decisions -- Prof. V. Chandra SekharaRao C Capital 1000 900 B 800 700 600 500 A 400 300 200 100 Labour OA = Increasing Returns; A to B = Constant Returns; B to C = Decreasing Returns
Input-Output Decisions -- Prof. V. Chandra SekharaRao • Scale and Proportion: Same diagram shows presence of constant returns to scale and diminishing marginal productivity of labour. • Along the lines, OA, OB, and OC, the distances between the Iso-quants are equal, signifying constant returns to scale. • When Capital is held constant at OK and production is expanded by adding more labour, the distances between the iso-quants become greater, that is, more and more labour is needed for each 100-unit gain in output. It shows diminishing MP of labour. EF < FG < GH