Download
1 / 48
490 likes | 666 Views
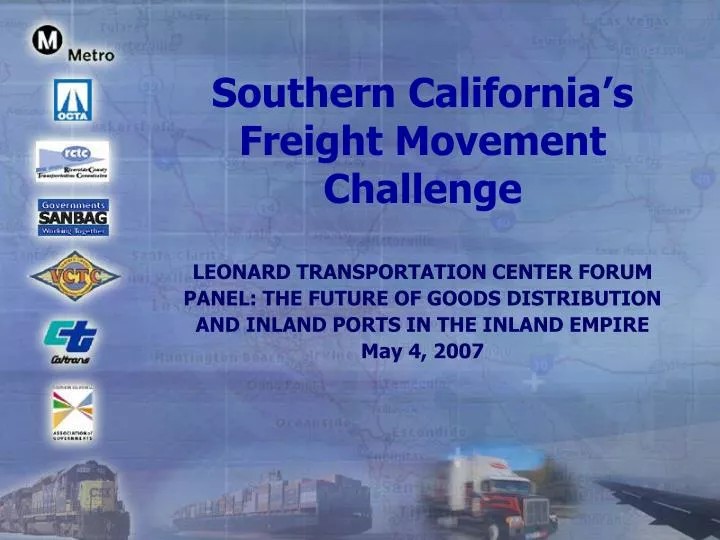
Southern California’s Freight Movement Challenge. LEONARD TRANSPORTATION CENTER FORUM PANEL: THE FUTURE OF GOODS DISTRIBUTION AND INLAND PORTS IN THE INLAND EMPIRE May 4, 2007. Southern California National Freight Gateway. Value of Imports Moving Through the Los Angeles-Long Beach Ports

E N D
Southern California’s Freight Movement Challenge LEONARD TRANSPORTATION CENTER FORUM PANEL: THE FUTURE OF GOODS DISTRIBUTION AND INLAND PORTS IN THE INLAND EMPIRE May 4, 2007
Value of Imports Moving Through the Los Angeles-Long Beach Ports by Congressional District
Southern CaliforniaTransportation Today: Texas Transportation Institute, 2005 Urban Mobility Report
Like adding twoChicagos… SCAG Region 2030 Forecast Population & Employment Growth (Millions) 2000 2030 Increase Population16.8 22.9 37% Employment6.8 10.5 54%
The Recipe • Federal policy supports global trade • Export manufacturing jobs to overseas sources of cheap labor • Import manufactured goods from overseas • Price of imported goods fails to internalize transportation, environmental, and social costs
LA-Long Beach Projected Container Growth 44% US Import Market Share 25% US Export Market Share In Million TEU’s Source: POLA, POLB
15,835 2,557 1,776 59,420 Seattle 4,478 4,396 1,798 NY/NJ 5,566 1,809 Tacoma Virginia 3,382 2,043 6,639 Oakland 1,860 13,101 9,420 Charleston 1,662 6,165 1,437 2,152 Savannah 1,010 LA/LB Houston Miami (TEUs in thousands) 2004 2020 USDOT Freight DemandForecast to 2020 From presentation by Jeff Shane, Under Secretary for Policy, USDOT, April 3, 2006
Local Port ofOakland LA-Long Beach Ports Out-of-region 0 5 10 15 TEUs (millions) Serving the NationLocal vs. Interregional Freight CA Goods Mvmt. Action Plan and SANBAG
Where’s It All Going? Transported In original container to/from External O/D 37% Transloaded; O/D outside Region 40% O/D is Local 23% 0% 20% 40% 60% Leachman and Associates LLC -Port and Modal Diversion for SCAG
The Transloading Advantage Transloading of weekly shipments from Asia affords large, nation-wide retailers an 18-20% reduction in their total pipeline plus safety stock inventory compared to direct shipping from Asia. Assuming a 6% average error in nationwide one-week-ahead sales forecasts Leachman & Associates LLC
So. Cal inland transloading & distribution facilities:1.5 B sq.ft. of roof = 15% of nation, 60% of west coast Ontario/ Mira Loma, San Bernardino and Riverside Counties. Ontario Airport for scale
LOGISTICS: Economic Opportunity…(Dr. J. Husing) Blue Collar Good Entry Level Pay Defined Skill Ladder On The Job Learning Heavy Use of Information Technology Has To Be In Southern California
Trucks: Projected to nearly double Trains: nothing will move without improvements Left Unaddressed, Landside Congestion and Unhealthful Air Will Bring Port Growth to a Halt By 2025:
And key findings of the Leachman Port and Modal Elasticity Study are: • Inadequate landside freight capacity will strangle port growth absent major improvements • Port traffic is more likely to be diverted by failure to address landside congestion than from modest container fees used to improve reliable throughput
Daily Truck Traffic to/from LA/LB Ports Will Grow Dramatically Source: Gill V. Hicks Associates, more recent data: 2005=54,600, 2030=142,000
Train Delays on Existing Trackage Year Train Type Average Delay per Train BNSF Freight 31.9 minutes 2000 UP Freight 30.4 minutes Forecast Train Delay (Year 2000 passenger trains and no system capacity improvements) Year Train Type Average Delay per Train BNSF Freight 206.3 minutes 2010 UP Freight 196.9minutes Source: Leachman and Associates Mainline Rail Study for SCAG
Intermodal Yard Capacity and Demand (Millions of Lifts1) 1 One lift = 1.85 TEUs 2 BNSF’s Commerce facility to added 200,000 Dec. 2002 and Pier 400 added 1.12 million lifts 2004 Source: Gill V. Hicks and Associates
The Pollutants Freight Movement Creates are Jeopardizing Our Health • The Region continues to have the worst air quality in the U.S.
Diesel Particulates… …comprise 71% of the major air pollutants contributing to cancer risk in the South Coast Air Basin
Estimated Risk of Cancer from Airborne Toxics: Excluding Diesel Cancers per million Source: SCAQMD, Multiple Air Toxics Exposure Study II, March 2000
Estimated Risk of Cancer from Air Toxics: All Emission Sources Cancers per million Source: SCAQMD, Multiple Air Toxics Exposure Study II, March 2000
PM2.5 Disproportionate ExposureSouth Coast Air Basin Population-Weighted Exposure Above NAAQS Based on2000-2002 AIRS Data Rest of Nation 48% Rest of California 18% South Coast 82% South Coast 52% Source: California Air Resources Board
Recent CARB Assessment of PM Health Effects SCAB Cases/Year due to PM2.5* Premature Deaths 5,400 Hospitalizations 2,400 Asthma & Lower Respiratory 140,000 Symptoms Lost Work Days 980,000 Minor Restricted Activity Days 5,000,000 • 1999-2000 Air Quality Data Source: California Air Resources Board
NOx Emissions Trend By Source Category and Carrying Capacity PM2.5 Carrying Capacity (443) 8-Hour Ozone Carrying Capacity (114)
NO VOC SO PM2.5 x x How Are We Going to Attain PM2.5 Reduction Targets? TONS PER DAY 2014 Baseline Percent Reduction Needed 203 59 24 14 (31%) (11%) (57%) (14%) 654 527 43 102
2014 PM 2.5 Attainment Draft 2007 AQMP Tons/Day 203 -6 -125 -72 Target AQMD Stationary Measures CARB’s Strategy Unknown
Draft 2007 AQMP 2023 OZONE Attainment Tons/Day 383 -8 -139 -57 -179 NO Target AQMD Stationary Measures CARB’s Strategy AQMD Additional Measures Unknown x
HHD Diesel Truck NOxEmission Factor Comparison Reflects Base Emission Rates and Deterioration at 500,000 miles Source: California Air Resources Board 2006
FEUs in millions 5.0 $200 4.5 Total Volume Minimal Decrease in Total Volume Trans Loading Volume 4.0 3.5 2004 Annual Volume 3.0 2.5 2.0 1.5 Slight Increase inTrans Loading Volume 1.0 0.5 $30 60 90 120 150 180 210 240 270 300 330 360 390 420 450 480 Container Fee (per FEU) in dollars SOLUTIONS?Container Fees Used to Finance Congestion Relief Assumption: Fees on inbound loaded containers only
SOLUTIONS?Dedicated High-Speed, Clean, Grade Separated Freight Corridors and Inland Ports
Solutions will require: • High-Level commitment to collaborate among regional, state, and federal agencies (e.g., the MOU) • Extensive private sector involvement and financing • Community involvement (ultimately, support) • A Win-win outcome: - attainment of healthful air quality - mitigation of community impacts - private sector value in return for investment
Challenges Summarized • Finance – requires new funding, users and beneficiaries must contribute • Environment – timely AQ attainment despite 3x increase in shipping & freight throughput • Performance – assure infrastructure benefits • Communities – acceptance and support essential to progress • Institutions – unclear implementation responsibilities, limited federal recognition • Implementation – in one decade, not three
Efforts completed or in progress • Multi-county Goods Movement Action Plan CTCs, SCAG, Caltrans • State Goods Movement Action Plan California BTH, CalEPA • Emission Reduction Plan for Ports and Goods Movement in California California Air Resources Board • San Pedro Bay Ports Clean Air Action Plan Port of LA, Port of LB • Freight Movement Executive Roundtable Execs. From shippers, railroads, trucking, CTCs, SCAG • Inland Empire Goods Movement Coalition / So. Cal. Leadership Bi-county private sector group in alliance with LA and Orange Co. interests • I-15 Comprehensive Study (complete) SANBAG, RCTC, Caltrans • I-710 Project Development MTA, Caltrans, Gateway Cities • Port and Modal Elasticity Study (complete) Leachman & Associates for SCAG • Mainline Rail Study (complete) Leachman & Associates for SCAG • Logistics & Distribution: An Answer to Regional Upward Social Mobility (complete) Dr. John Husing for SCAG • Alameda Corridor East grade separations SANBAG, RCTC, Ontrac, ACE Construction Authority
What we ask… • Participation in a collaborative process, convened by the transportation agencies, ports, communities, and the State and federal governments, to formulate and efficiently implement a strategy to address the challenges and grasp the opportunities facing the nation’s largest international freight gateway
SCAG Multi-County Freight Infrastructure Planning USDOT Congestion Strategy Southern California National Freight GatewayCollaborative Strategy PRINCIPAL CONVENORS Ports CTCs SCAG STATE FEDERAL Administration SCAG Way of working: • Scoping • Respectfully stitching together the quilt • Promoting cooperation & collaboration regarding initiatives Facilitation Team Dialogue/ Facilitation/ Brainstorming StateGMAP Process Information management/sharing Coordination of regional environmental studies - ROUNDTABLE Ontario Center/ I-10 Blue-print Demonstration Project Regional Institutional implementation arrangements Transportation/Blue print/community partnerships / Projects in Process Transportation/ Blue print/ Open-space Program Transportation/ Air Quality Partnership Transportation/ W.Q. Partnership